 World of O News

Many interesting long legs in this years 10Mila means a lot of interesting analysis using the GPS data! Now the GPS Tracking is online – get ready for some fun understanding the best options. Why not use the opportunity to learn something as well – draw your suggested best route on each leg before reading the analysis. Adding a comment makes it easier for other to understand why you choose a certain route.
The 10Mila relay had very nice courses this year – a “Jukola-like” gaffling system – i.e. more gaffling than we’ve seen the last years – along with many long legs made it really interesting for the runners.
Disclaimer for all my analysis/comments: I have not been in the forest – analysis and comments is done based on GPS data only – thus conclusions might not always be 100% correct. But PLEASE correct me in a comment if I’m wrong – that would make everybody happy, especially me.
Link to GPS tracking
Here you find links to the GPS tracking (will be updated with more legs):
- Men’s relay, leg 3
- Men’s relay, leg 4
- Men’s relay, leg 6
- Men’s relay, leg 7
- Men’s relay, leg 9
- Men’s relay, leg 10
- Women’s relay, leg 3
- Women’s relay, leg 4
- Women’s relay, leg 5
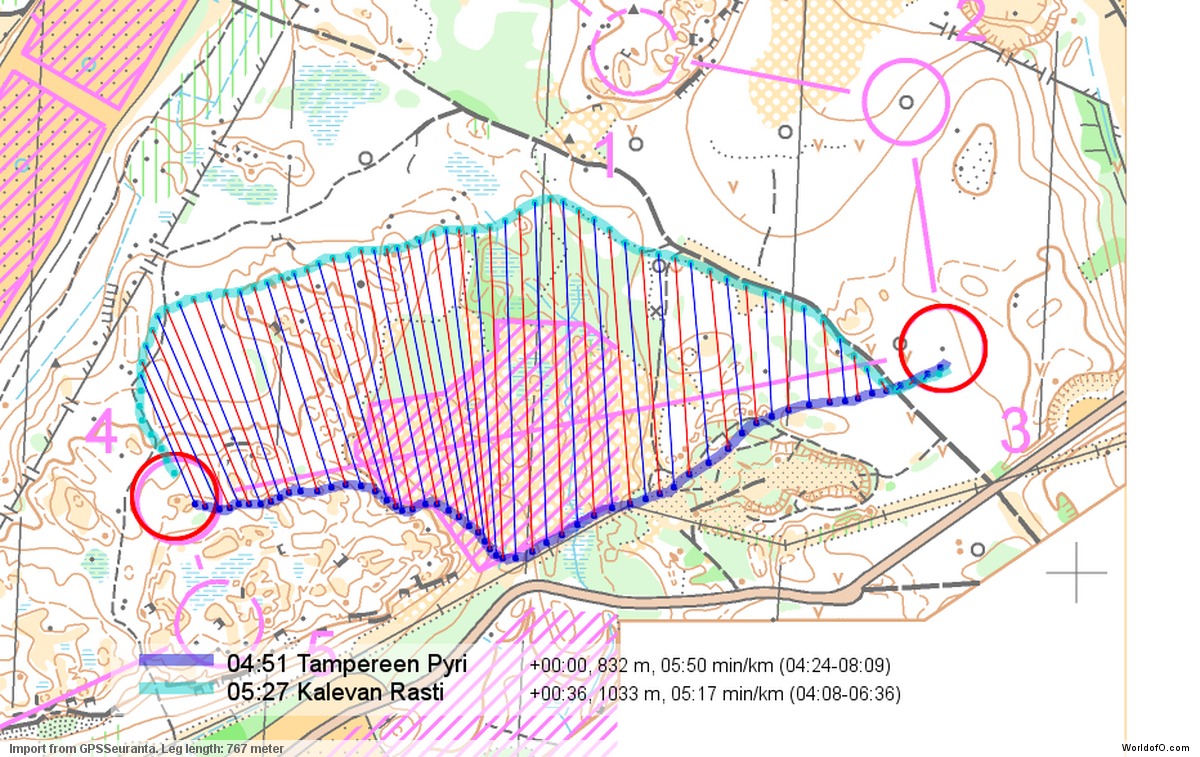
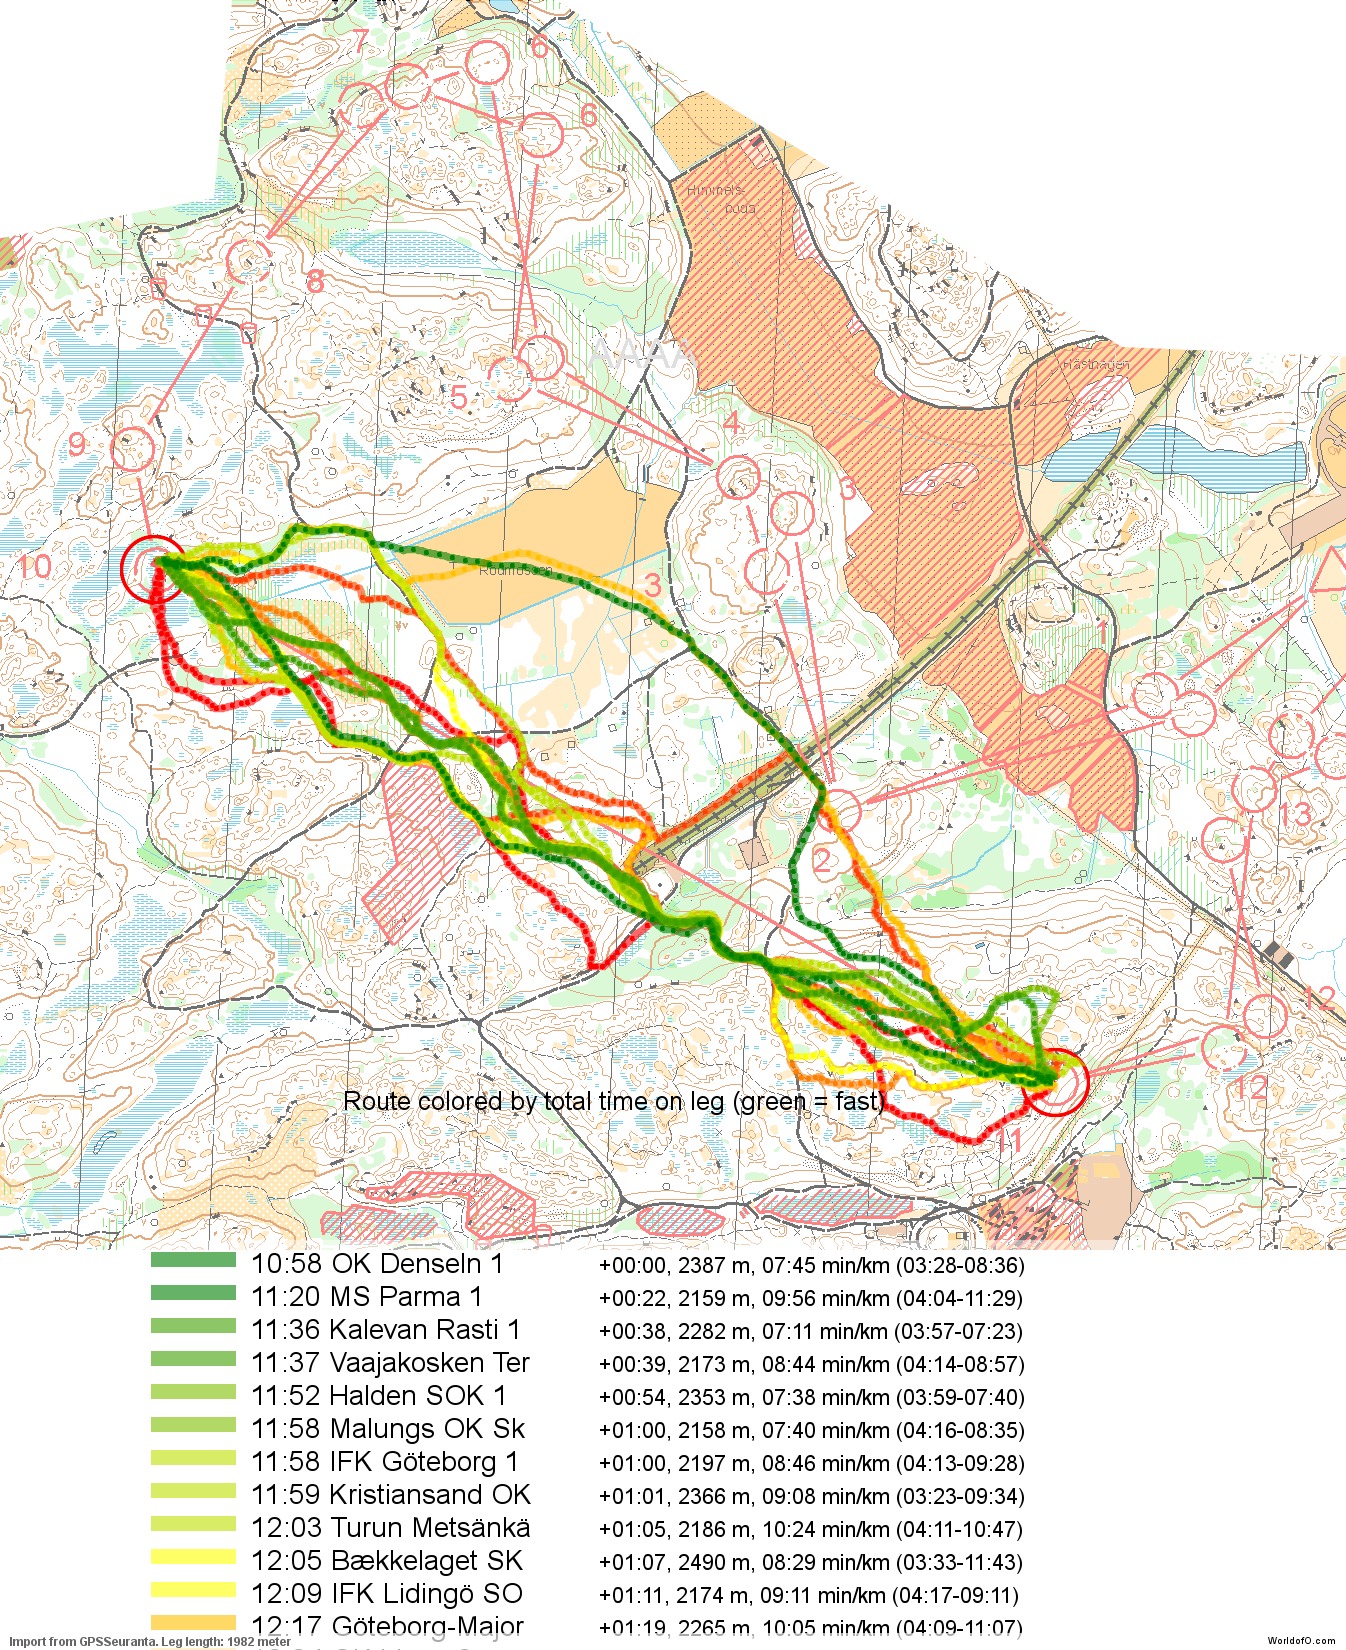
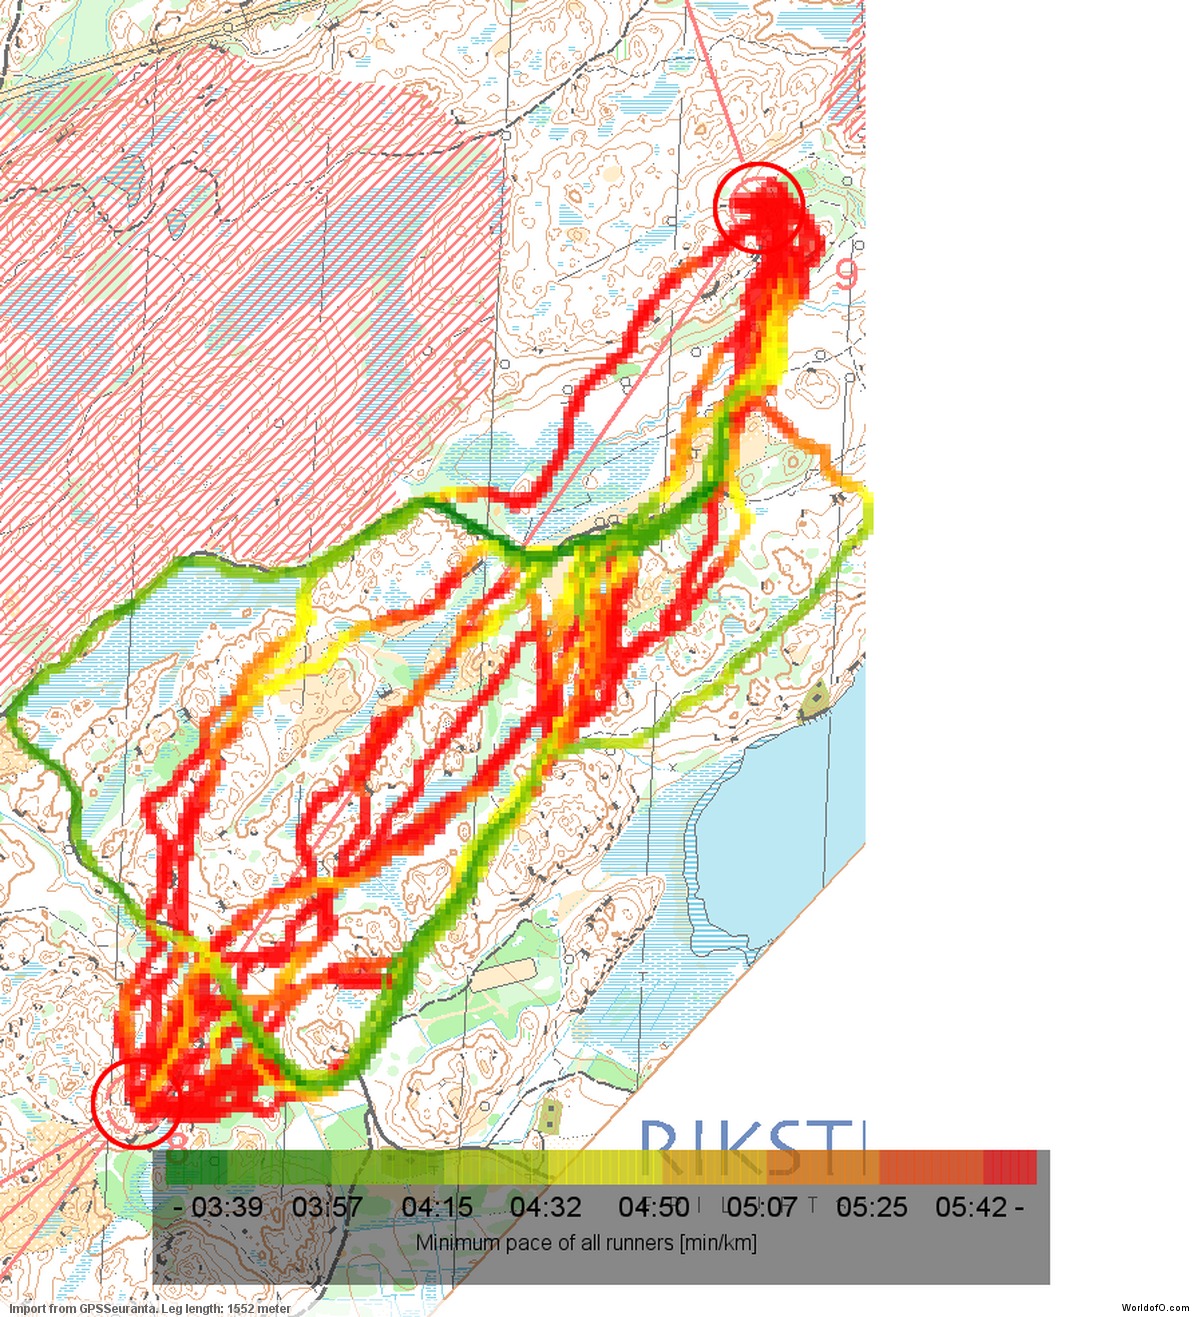
Analysis – 6th leg, control 10-11
We’ll start with a webroute to get your thoughts going – below is analysis of both this leg and other legs. This is control number 10-11 on the 6th leg of the men’s relay – a night leg. The leg is as usually first provided without routes – you may take a look at it and think about how you would attack this leg (if the image is too small, you may click on it to get it larger).
![]()
Next you can draw your own route using the ‘Webroute’ below. Think through how you would attack this leg, and draw the route you would have made. Some comments about why you would choose a certain route are always nice for the other readers.
Now you can take a look at a graphical analysis of the leg based on the GPS-data of some of the fastest runners between these controls (click on an image to see a larger version of it). Note that times are off the GPS, so there might be some inaccuracies at the start/end of each route/track.
The leftmost option surely looks to be the best option on this leg on nightorienteering
Analysis: There are basically three options for this leg: (1) A direct option passing along the edge of the forbidden area – see MS Parma’s route, (2) A left variant with 80% path, open field and road – mostly large paths – see OK Denseln’s route. (3) A right variant with more than 90% paths – significant amounts of that being small paths. Of the teams with GPS tracking, most teams have taken variants of the direct option with some curves here and there to use paths. Some have taken the left option, but none have taken the rightmost option (note however that the two first drawing their webroute choose the rightmost option).
Looking at the illustrations below, you can see that the fastest time is run by OK Denseln running the left variant even if it is more than 10% longer than the direct route. The reason for this is the very high speed you can run in on the road/track/open field, which is very nicely illustrated on the pace map. Also, the direct route is not really direct – you actually do a lot of curves when trying to run it optimally, giving a running distance of around 2160 meters on the 1980 meter long leg (the leftmost is around 2390 meters). Add to that that the leftmost route is much more secure than the direct route (many obviously could not keep their direction), the leftmost option surely looks to be the best option on this leg on nightorienteering. The rightmost option could look tempting due to the amount of running on paths, but as (1) small paths are usually slower and (2) it is longer than the rightmost route, I’d think the leftmost route is the choice to take here.
Figure: Direct comparison between routes. Points along the routes at which the runners have used the same time are connected – thus you can easily see where one route is faster/slower than another.
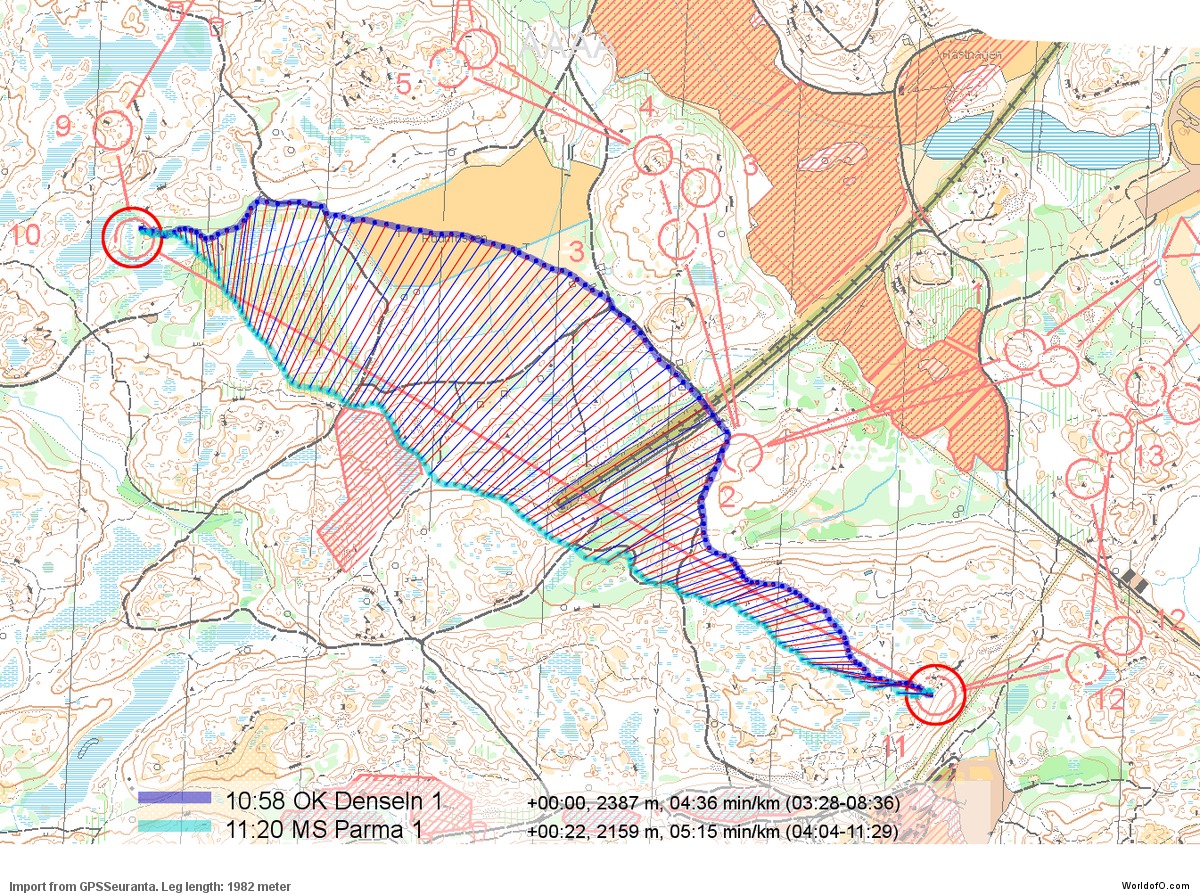
Figure: Pace map – each point along the routes is colored according to the minimum pace at that point. Thus is is possible to identify where the runnability is good/bad.
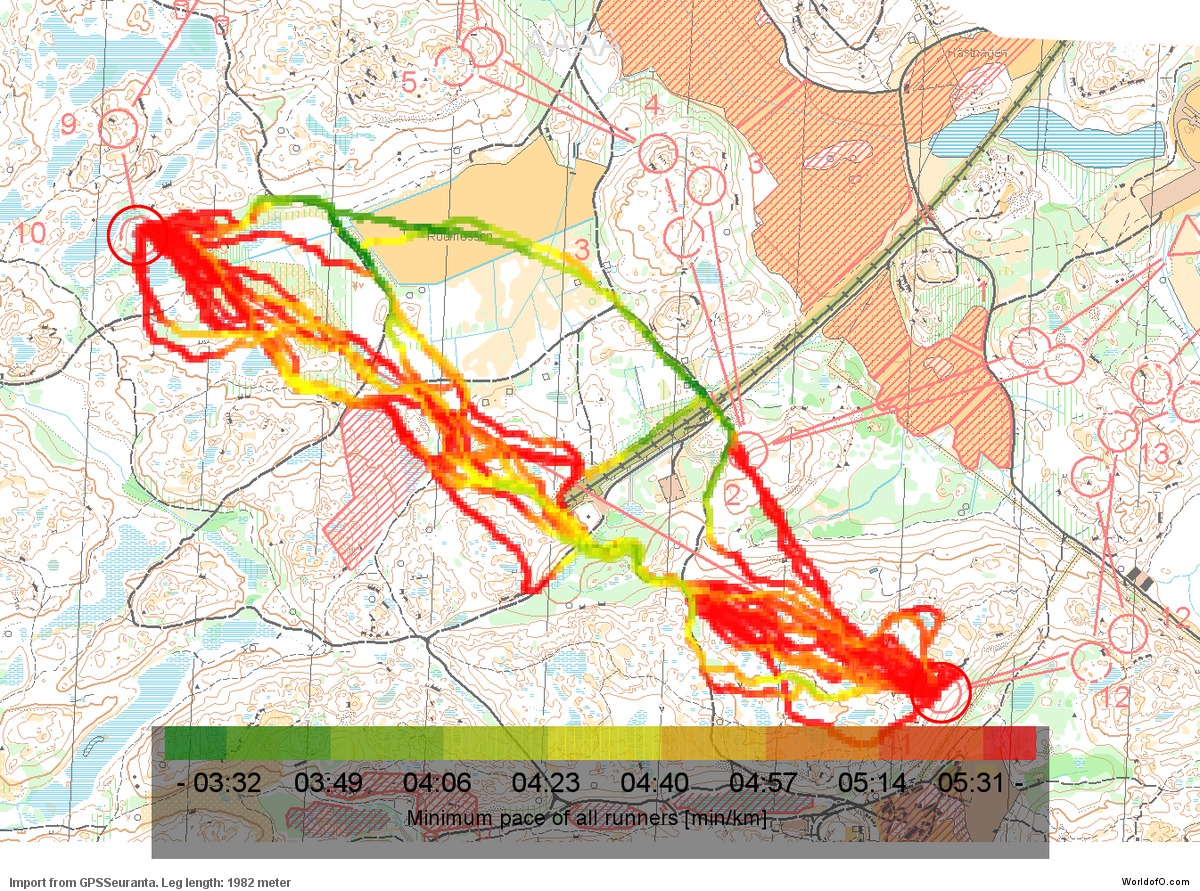
Figure: Routes are colored according to total time on the leg – green is fast, red is slow.
Analysis – 3rd leg, control 8-9
This is also night orienteering – this time control 8-9 on leg number 3. Again you get the possibility to think through the route and drawing your route before reading the analysis.
![]()
Draw your own route using the ‘Webroute’ below.
Analysis: There are four different options for this leg. (1) A direct variant going mostly in the terrain except for the last part of the leg (light blue below), (2) a rightmost variant following small paths at the first part of the leg and then meeting the direct route for the last part of the leg (dark blue), (3) a long far left variant on the road (red) and (4) another left/direct alternative (pink).
When looking at the split times, I was at first surprised that the direct route was only a few seconds slower than the rightmost route which is the fastest
Looking at the split times, the right variant is the fastest followed by the direct route (see the first illustration below where the fastest runner along each of the alternatives is shown). The rightmost is the fastest route due to (1) large parts of the route is on paths while (2) the route is not significantly longer than the other alternatives. When looking at the split times, I was at first surprised that the direct route was only a few seconds slower than the rightmost route which is the fastest.
The reason for this is found when you study the first part of the leg in some detail. In the second illustration below, a “dot-map” is shown – connecting times at which each runner has used the same time on the route. Here you can see that the runner taking the rightmost option is on the road nearly 30 seconds after the runner taking the direct option. Thus in the end there is only a slight advantage of some seconds by taking the rightmost option. On the other hand, the rightmost choice is in my opinion a better and more “night orienteering route choice”, as there is significantly more path running (and not even on small paths). Talking about night orienteering route choices, the far left option on the road and track is a real night orienteering route choice. However, it is far too long in this specific case. The runnability is not that bad for the runner taking the rightmost option on the path.
Looking at the colored routes of all runners running with a GPS in the third figure below, you can clearly see that the right on the path seems to be the optimal. This is the route for which most runners have a good time. Looking further down at the fourth illustration, you see a pace map where the high running speed on the path to the right can be clearly identified.
Figure: Comparison of selected routes
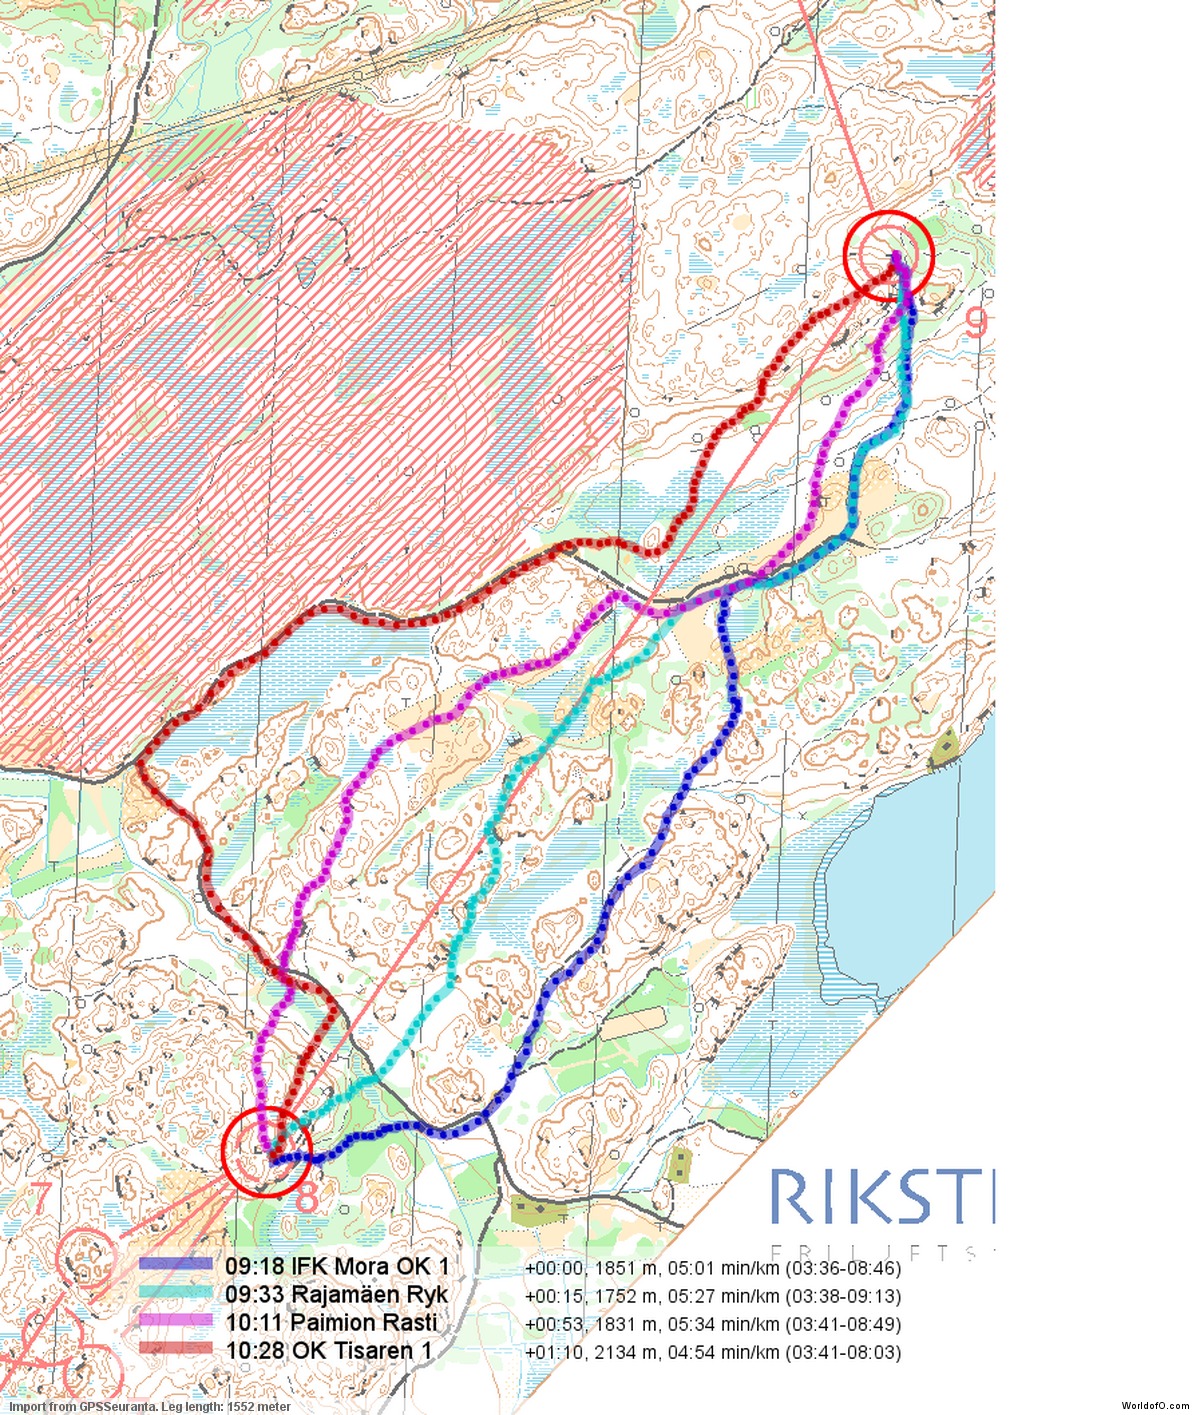
Figure: Direct comparison between routes. Points along the routes at which the runners have used the same time are connected – thus you can easily see where one route is faster/slower than another.
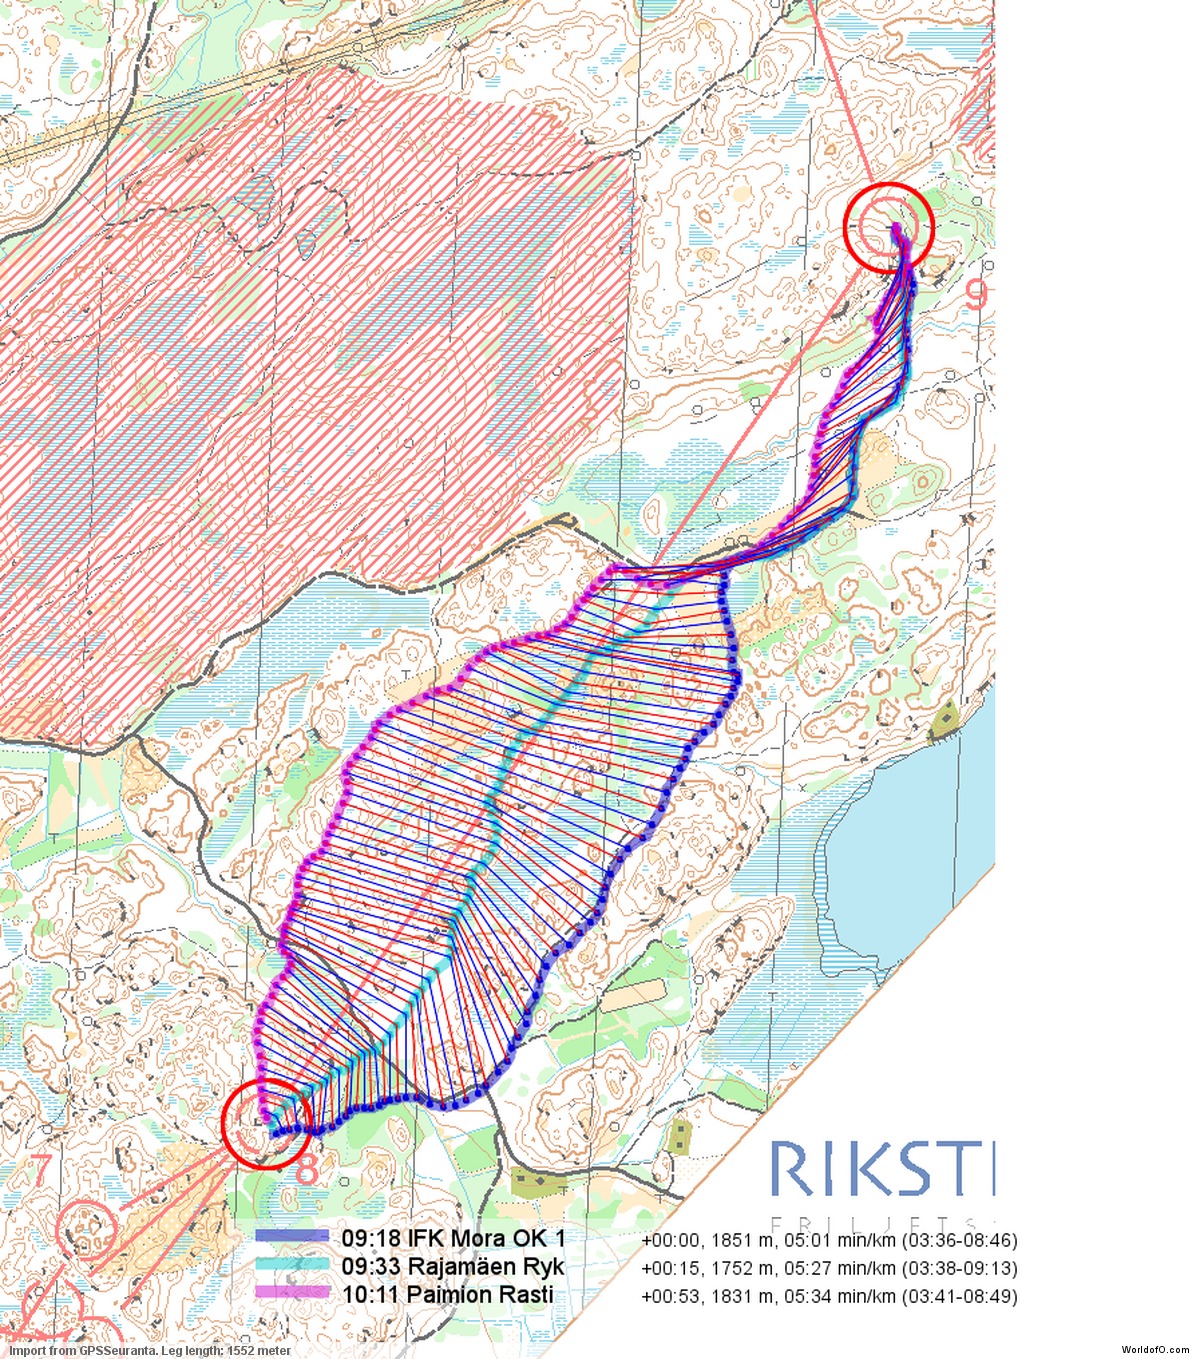
Figure: Routes are colored according to total time on the leg – green is fast, red is slow.
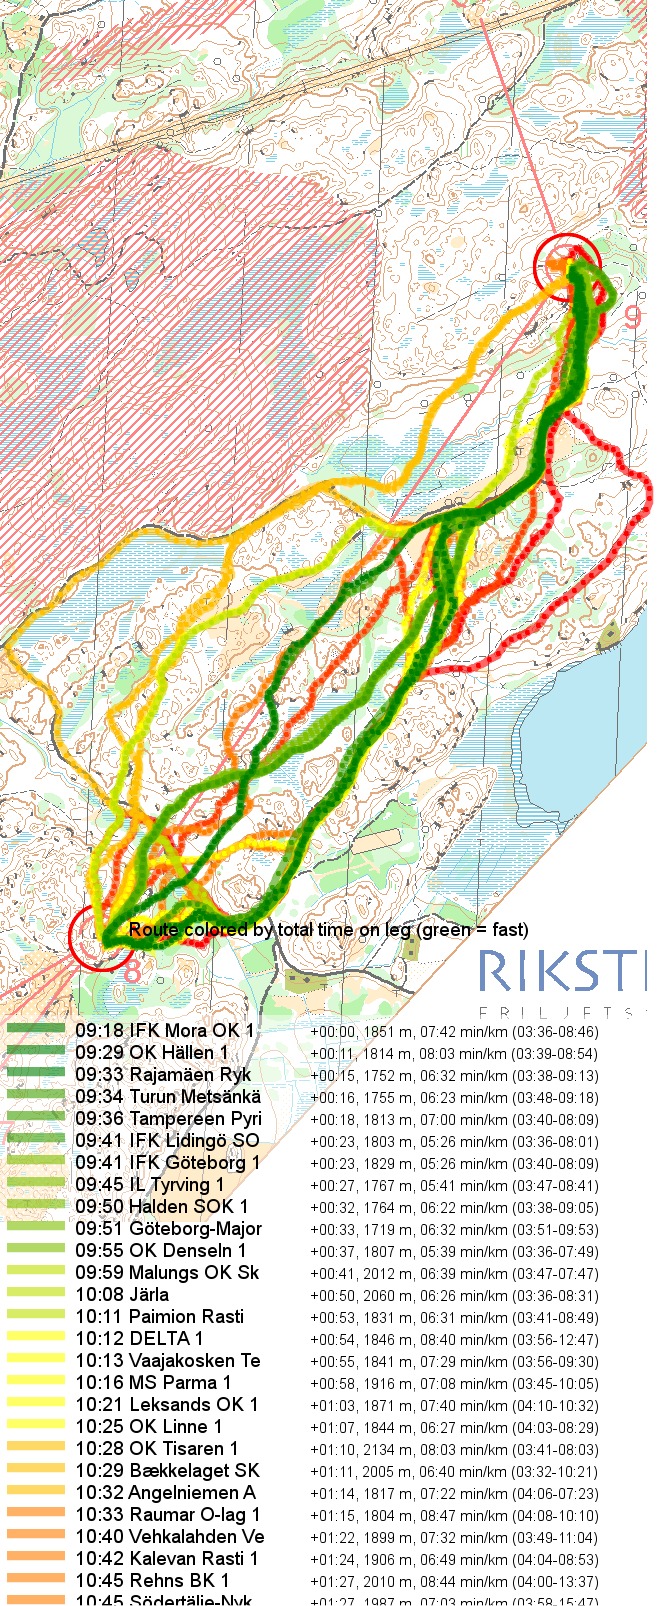
Figure: Pace map – each point along the routes is colored according to the minimum pace at that point. Thus is is possible to identify where the runnability is good/bad.
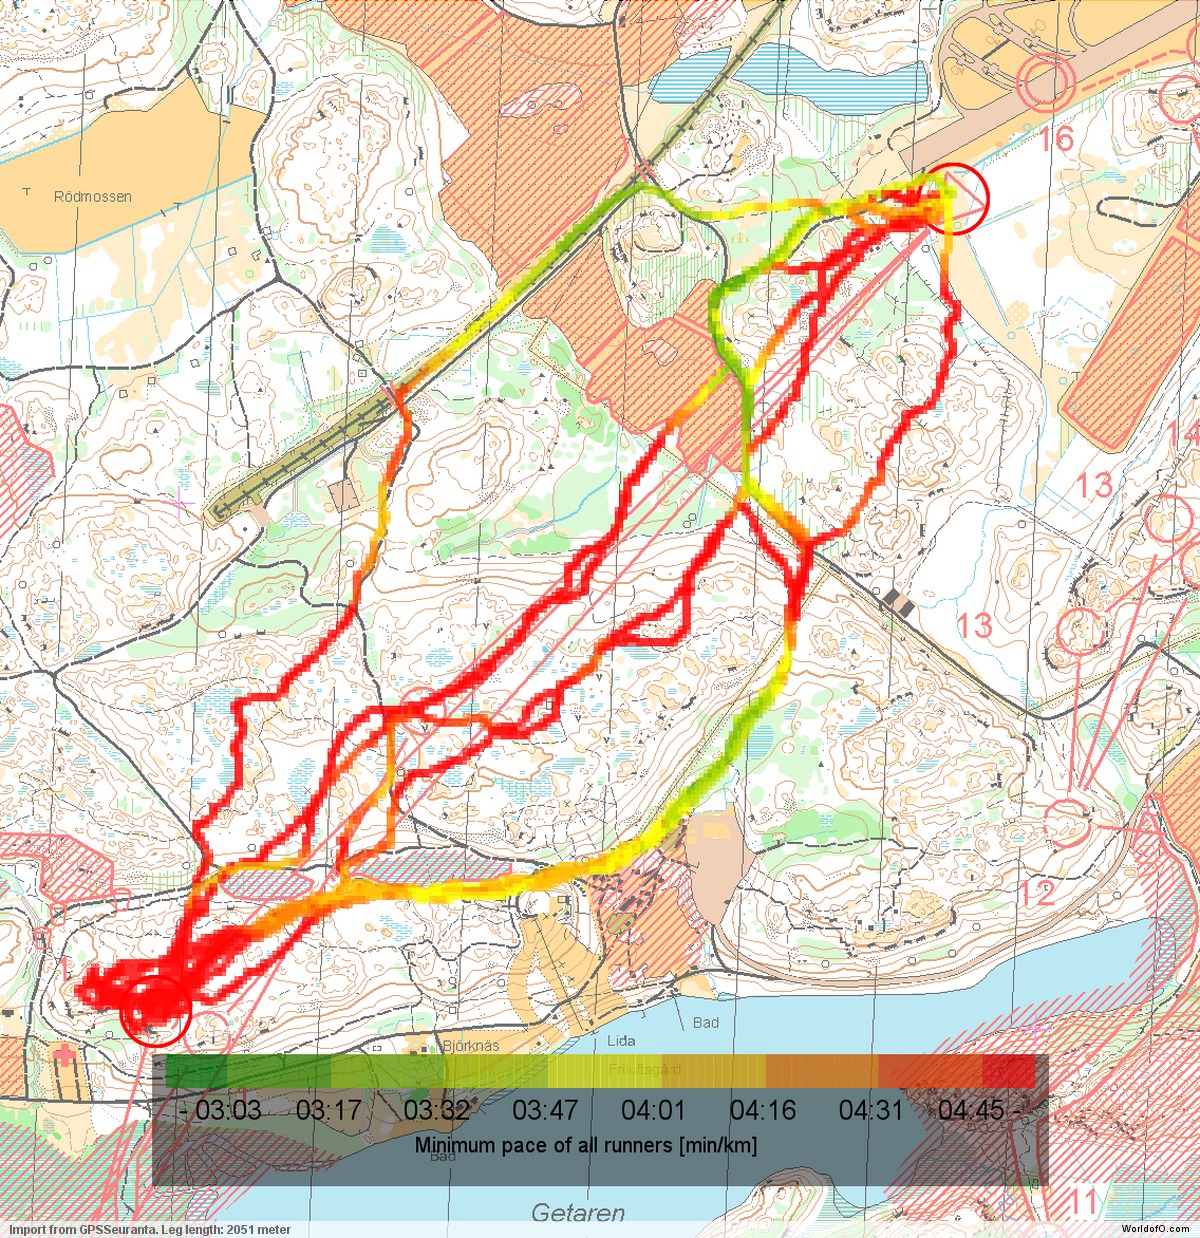
Analysis – 3rd leg, control Start-1 (gaffling W)
This is yet another control from leg number 3 – that means again night orienteering. This time we look at the first control on leg number 3. The most interesting of the gaffles for this leg is the westmost. Again you get the possibility to think through the route and drawing your route before reading the analysis.
![]()
Her you can draw your suggested route:
Analysis: Note that some of the GPS tracks shown below actually might belong to runners having one of the other gaffles but just passing this control – still the time should be relevant with respect to which time it takes to reach the control along each route. There were several alternatives for this route as you can see on the illustration below. The fastest route is the route of Kalevan Rasti (green in the first illustration) going all the way to the left.
The optimal route is actually calculated to be a direct route – passing the other gaffling control on the middle of the leg.
However, looking in more detail at the GPS data using a “same-time-illustration” (the second illustration below) where you see how long it would take a runner to reach any “reachable” point on the different routes, you can make two interesting observations,
- The optimal route is actually calculated to be a direct route – passing the other gaffling control on the middle of the leg. None of the runners taking this option and running with GPS seem to have managed to take the optimum route and find the control.
- Compared to Kalevan Rasti’s route, it should actually be just as fast to follow the route of Vaajakosken T. (light green) in the first part of the leg, and then following the route of Kalevan Rasti for the rest of the route.
However, both these observations are theory only – Kalevan Rasti took the fastest choice here. Still, it is interesting to note.
The final figure below is a pace plot show the maximum pace on different parts of the routes. It also shows that there was a lot of mistakes around the first control.
Figure: Routes are colored according to total time on the leg – green is fast, red is slow.
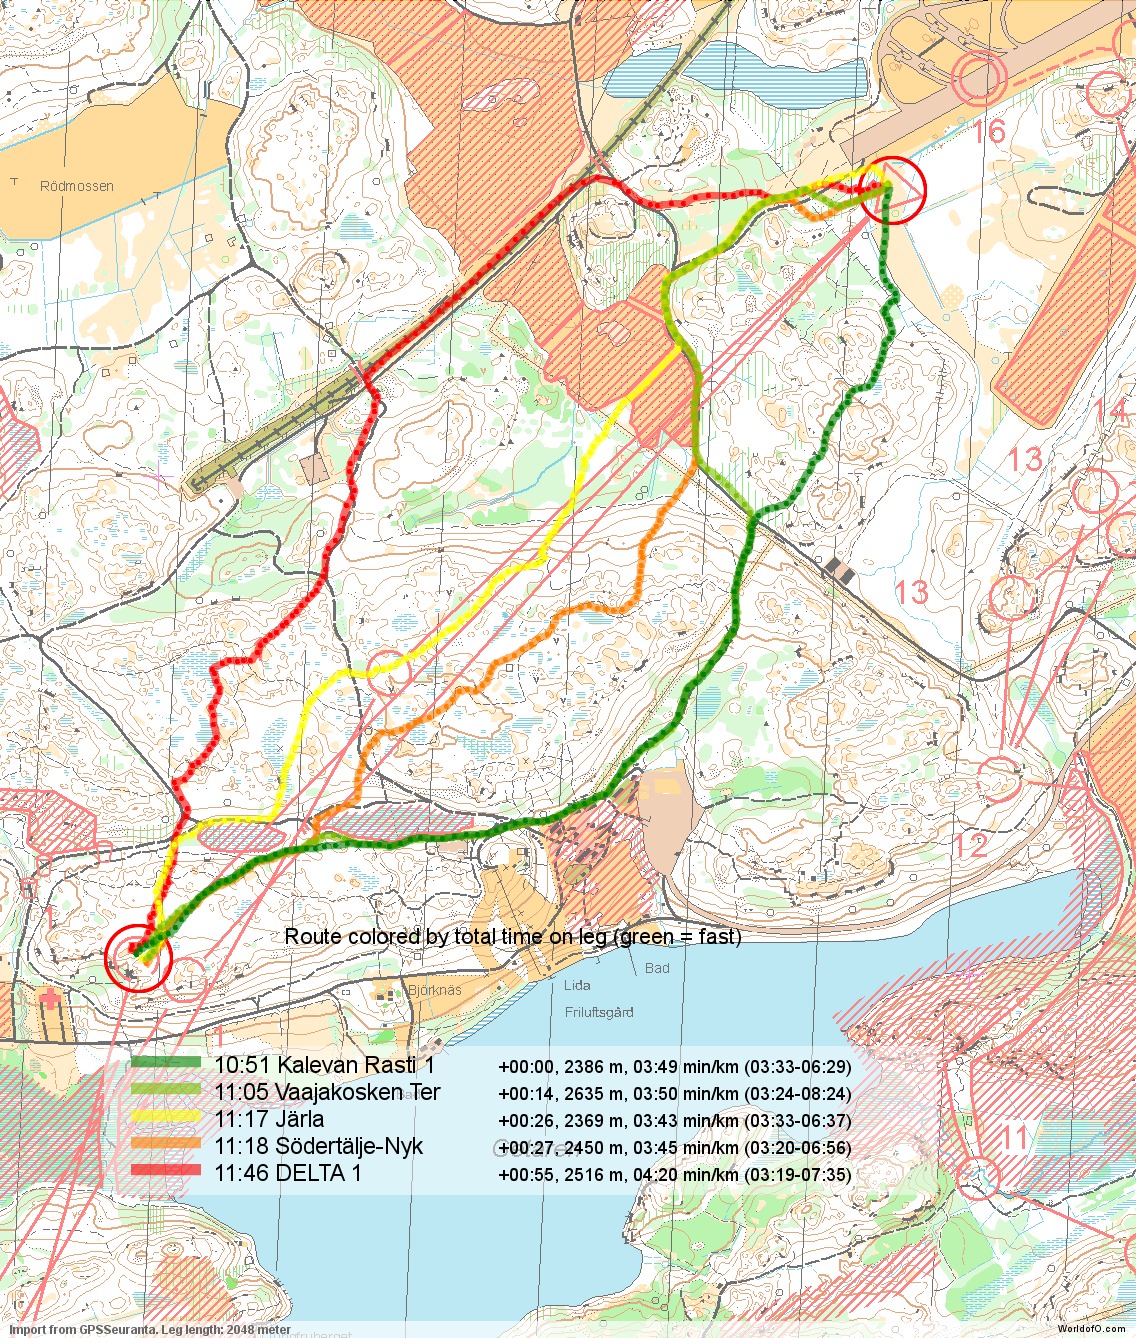
Figure: “Same-time-illustration” and calculation of optimum route.
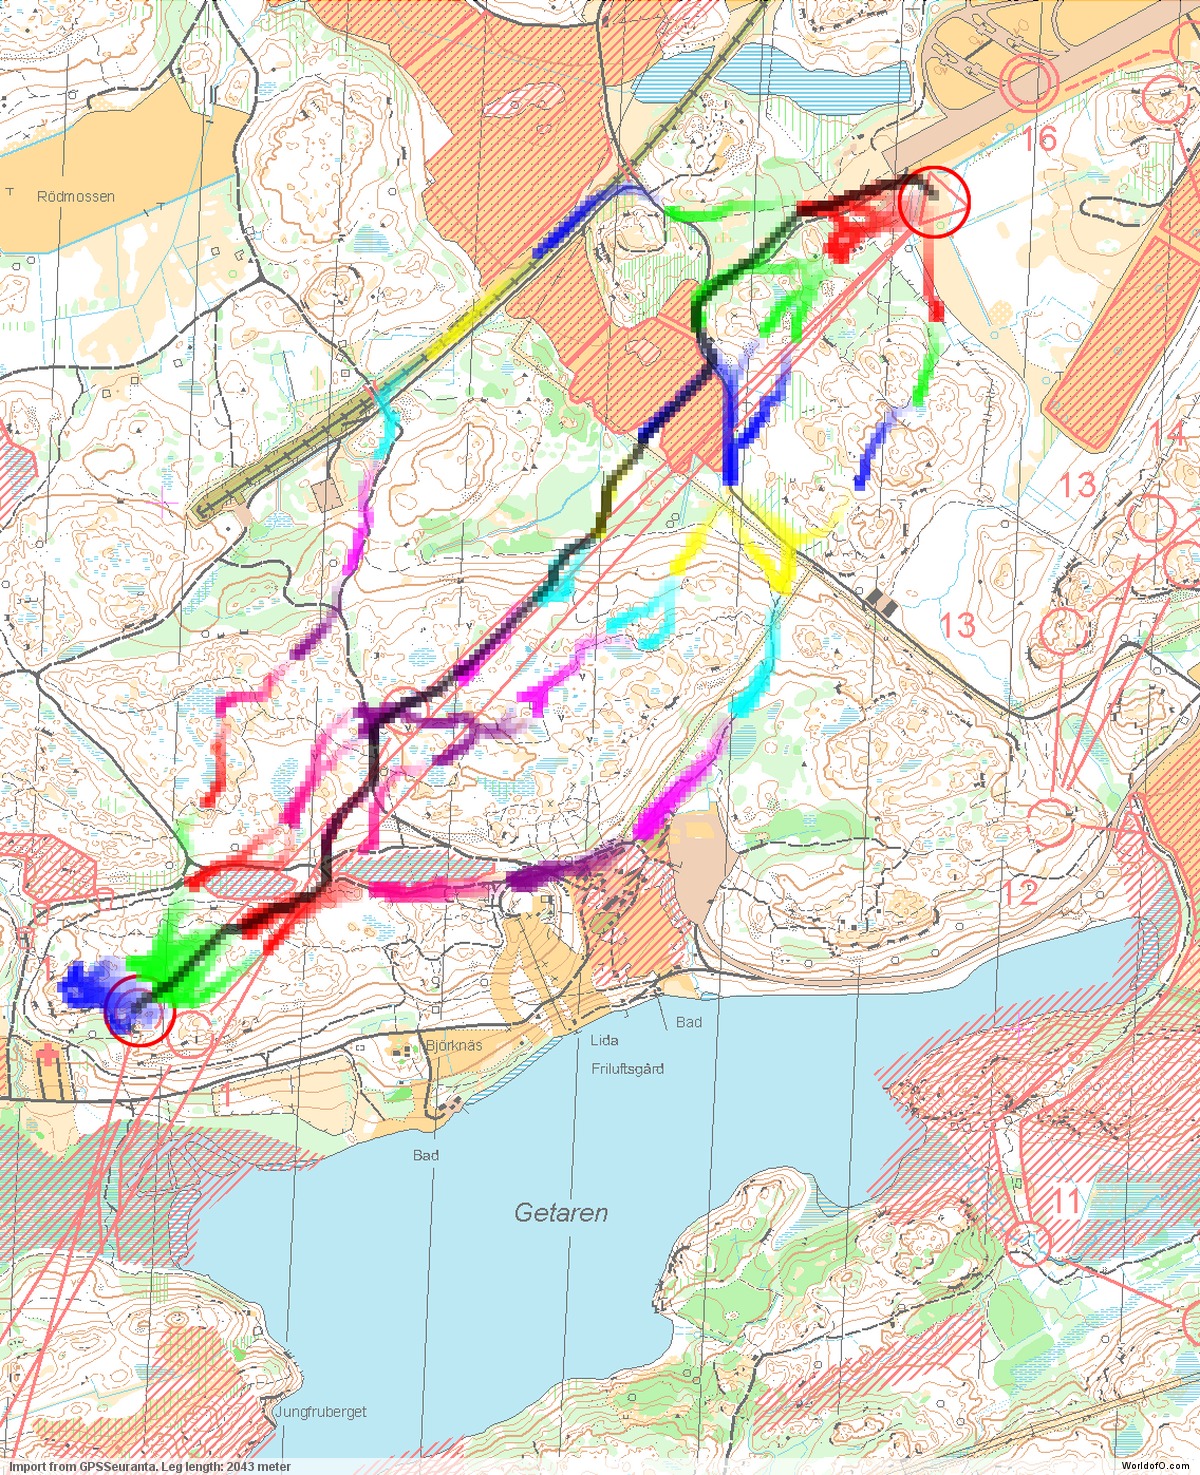
Figure: Pace map – each point along the routes is colored according to the minimum pace at that point. Thus is is possible to identify where the runnability is good/bad.
Analysis – Womens course – 3rd leg, control 3-4
Finally a leg from the women’s race – leg number 3 (ungaffled) day orienteering. Again you get the possibility to think through the route and drawing your route before reading the analysis.
![]()
Her you can draw your suggested route:
Analysis: This was a short leg on an ungaffled course, and it was very surprising to see this much spreading on the route choices (note however that the GPS data was not very good at this leg, so don’t trust the GPS data fully). For me it was surprising to see that many runners choose different variants to the right (see first illustration below) – as it is significantly longer, and there can not be much to gain by going right when you do not follow the path for significant parts of the route.
For me it was surprising to see that many runners choose different variants to the right
This can also be seen from the split times in the illustration. The ones choosing a left variant are clearly faster. There are some relatively fast splits on the variants to the right – and some slow to the left, but the trend is very clear.
Comparing the fastest of the left runners with the fastest of the right (second illustration below), you can see that the runner on the left can run very fast all the way to the edge of the forbidden area, and then has a lot shorter to the control than the runner on the right. 200 meter extra on a 800 meter leg can not be beneficial as long as the runnability is not significantly better on the longer route – here the runnability is approximately equal.
Figure: Routes are colored according to total time on the leg – green is fast, red is slow.

Figure: Direct comparison between routes. Points along the routes at which the runners have used the same time are connected – thus you can easily see where one route is faster/slower than another.