Here are some interactive illustrations to see the race development in the Jukola and Venla relays the last years.
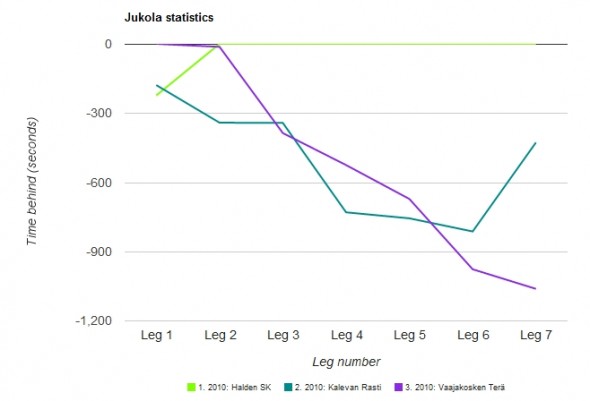
Taking a look at the Jukola statistics for Kalevan Rasti, we see that even if KR got second last year, it is their largest gap to the winner since 1998. The big time loss for KR last year came at the 4th leg were Martooma lost more than 6 minutes.
Since 2000, KR has never been in the lead until after the 5th leg (except for Romppanen taking the first leg in 2005). That is a very different development from Halden who often have been in the lead already from the second leg.
With Gueorgiou on the third leg, KR is now trying a different tactics obviously. They want to be in the lead already in the night legs, to be sure that nothing like last year will happen. Interesting tactics – it will be interesting too see how it works out.
- Jukola statistics for Halden, Kalevan Rasti, Kristiansand
- Jukola relay – winners the last 10 years and Jukola relay – top 10 2010
- Venla relay – winners the last 10 years and Venla relay – top 10 2010
The illustrations are interactive, i.e. you can swipe the mouse over any team/leg, and get information about who run the leg and the time loss for the leg.
 World of O News
