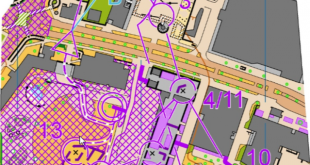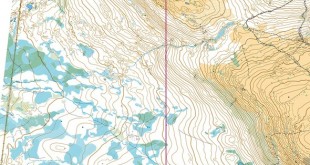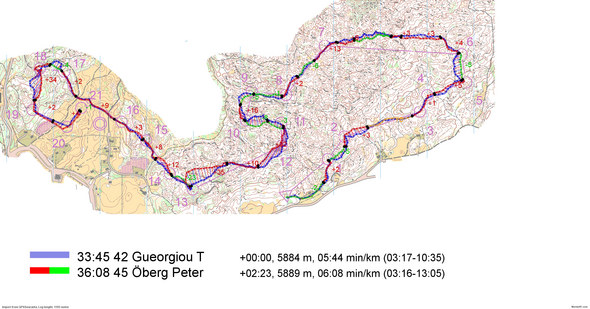
See how the WOC Middle distance was decided from this step by step comparison between Gueorgiou and Öberg using autOanalysis on the GPS-data. Öberg is nearly as fast in the start, but gets tired and can not keep up the orienteering all the way to the finish.
In the autOanalysis illustrations, the fastest runners has always a blue line. The slower runner has a green line where he is faster, a red line where he is slower, and an orange line where he is equal. This is a good way to illustrate in which part of the race a runner gained/lost time.
 World of O News
