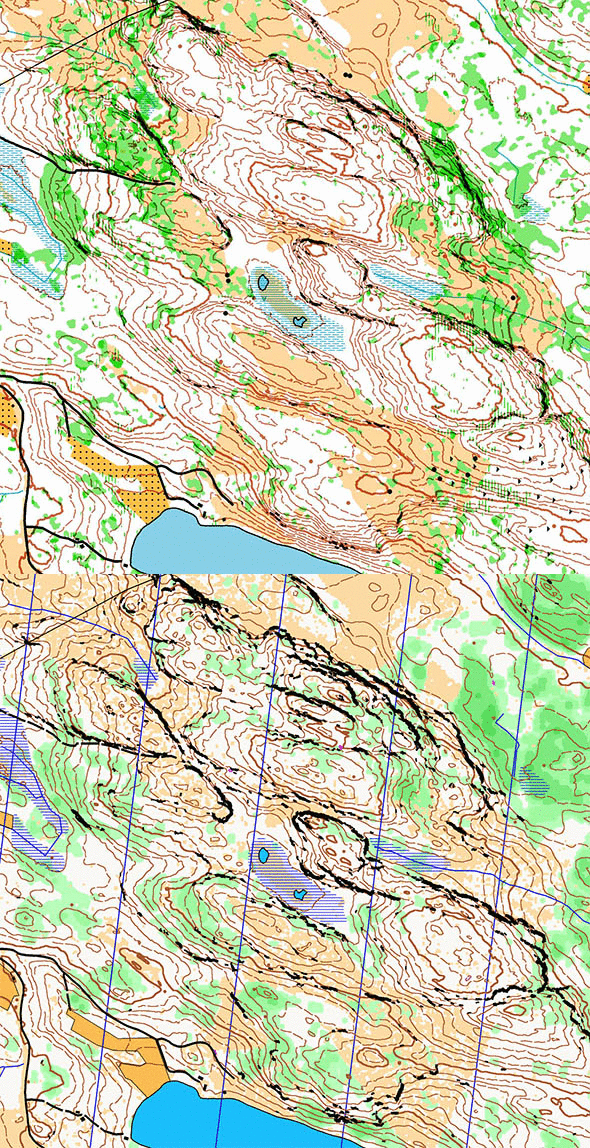
Start the preparations for Jukola 2014: Here are two different maps of the Jukola 2014 terrain – both made based on LIDAR (laser data). As a bonus a “RunningWild” with a 11 km long course and a Webroute for a hypothetical first leg is also included.
- Complete map comparison – click the map to toggle between the two variants (you have to wait for the map to completely load before starting)
Above you see a montage of two different maps made using LIDAR data (see link below for comparison of the complete maps). The first variant (with north lines above) is made by Jagge using Karttapullautin – an automated process which is quite easy to follow if you have some computer knowledge. The goal of Karttapullautin is to make a map which can be used for training without field-checking, i.e. only information relevant for the runner is retained. The second variant is made by Terje Mathisen – the work of Mathisen is generally geared more towards the mapmaker – to have a perfect base for field checking. That means that more information is on the map – some of which might be removed in the final version.
Which gives the most information? Which looks best for running? No matter which map you like best, this is yet another example of how useful this new technology is for orienteering. To be able to make this kind of maps in any remote location without field checking is just incredible!
RunningWild
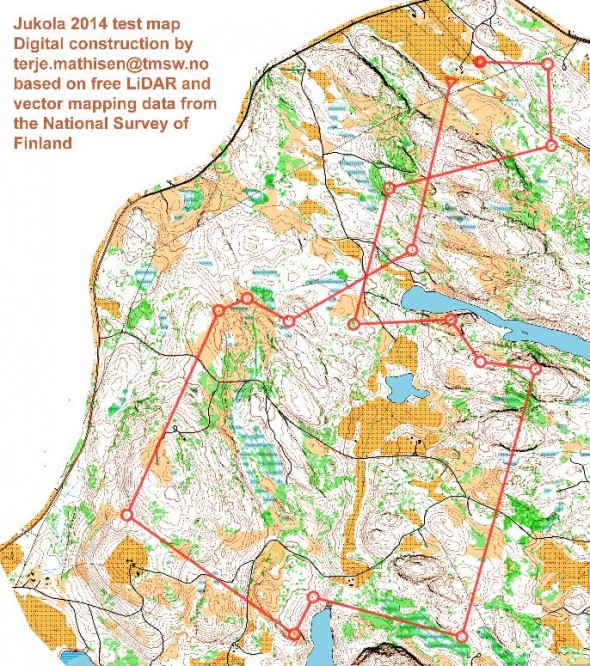
As a small bonus for those of you who are more interested in Jukola 2014 than in new mapping technology, here is a RunningWild on the map – a 11 km long course. RunningWild is a tool for theoretical o-technical training. Under time pressure you have to make exactly the same choices as in the forest: Figure out which route is the fastest, think through which attack points are the safest, and draw where you would run in an actual competition. With the added time pressure, your brain goes through the same processes as in an actual race – and afterwards you get instant feedback by comparing and discussing with others! For some RunningWilds you can compare your route with the GPS-track of an actual elite runner or the ideal route. For all RunningWilds you have the possibility to do leg-by-leg analysis of all drawn routes – studying if you agrees with others. You need a 3DRerun user account in order to comment and discuss – but not in order to draw your route.
Webroute
For those of you too lazy to try out RunningWild, here is a Webroute for the first leg in the RunningWild. First take a look at the map above to choose your route – next you can draw your own route using the ‘Webroute’ below. Think through how you would attack this leg, and draw the route you would have made. Some comments about why you would choose a certain route are always nice for the other readers.
 World of O News
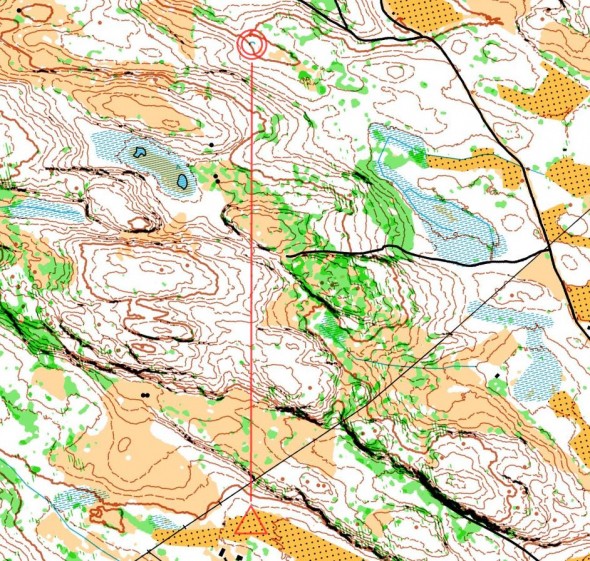
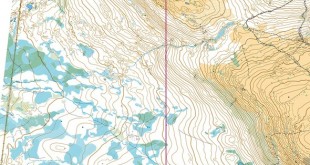
The main difference between our two maps is in the vegetation classification, my default settings (without feedback from either an old map or a short survey trip) is more likely to classify this area as white forest. OTOH my approach can also locate areas of dense brush vegetation underneath a high canopy, i.e. green stripes in white, something which Kartapullautin has problems doing.
The video from the organizers show that the areas that haven’t been logged are very nice indeed, but high-res orto photos indicate that at least some of the old logged areas should have been more green on my map.
I am currently taking samples of the terrain based on those aerial images, generating LiDAR height histograms in order to fine-tune my classification.
Thanks, Terje! Very interesting.
Intresting comparison. Terje and I will learn things from each other for sure here.
As terve wrote Karttapullautin did not originally detect dense vegetation under high canopy that well year ago, but the whole vegetation detection has been re-written last spring and it has been doing it pretty well since.