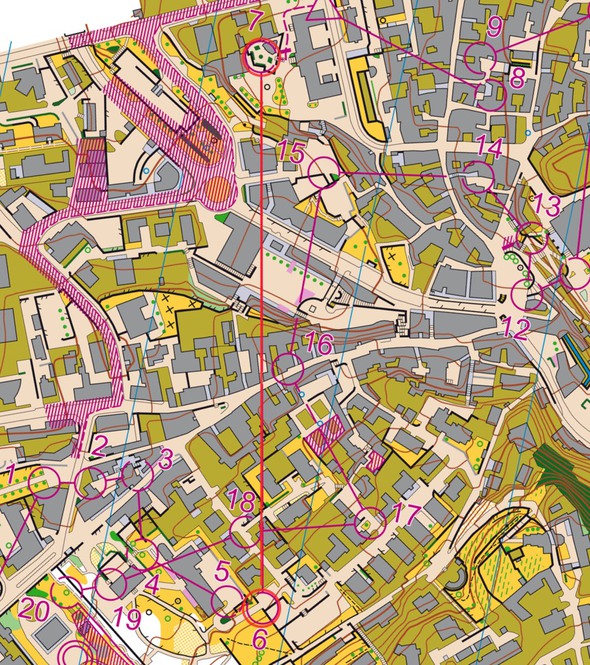
Today’s leg in Route to Christmas is a sprint leg – this time from one of the most important sprint races of the year, the European Championships Sprint in Switzerland. The chosen leg is used both in the men’s and the women’s class – for the men it is the leg to control 7 and for the women the leg to control 5.
The leg is as usually first provided without routes – you may take a look at it and think about how you would attack this leg (if the image is too small, you may click on it to get it larger):
Location
You find other maps from the area in omaps.worldofo.com here. See also latest additions in 3DRerun from this area in order to learn more about this terrain type.
Webroute
Next you can draw your own route using the ‘Webroute’ below. Think through how you would attack this leg, and draw the route you would have made. Some comments about why you would choose a certain route are always nice for the other readers.
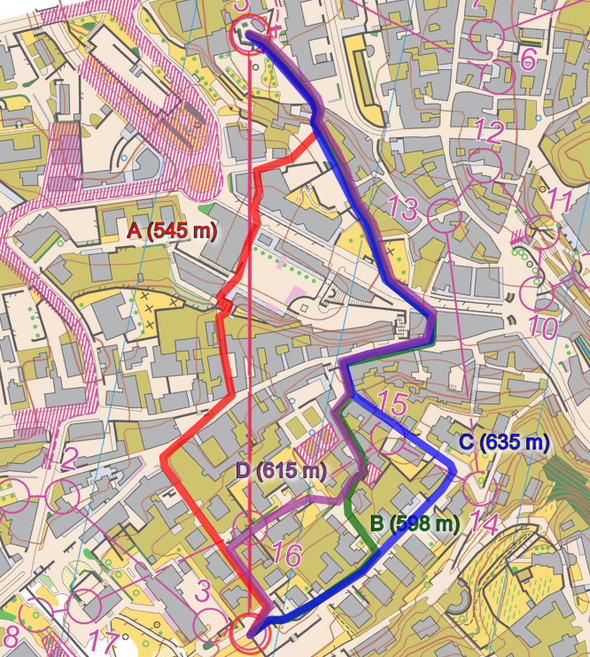
Let us first look at the alternatives. The shortest alternative is clearly the most direct (A, red) below, whereas there are several alternatives which are more to the right and longer. The S-shapes stairs on the middle of the leg is what might make you consider something else than the direct route, but this is probably less costly than going that much longer?
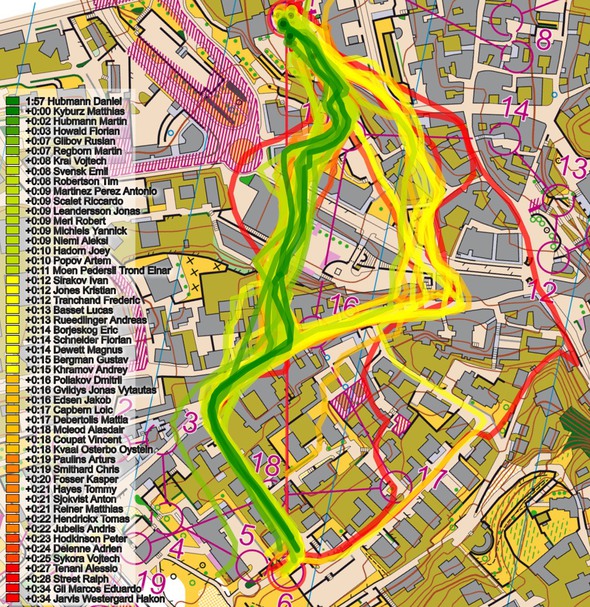
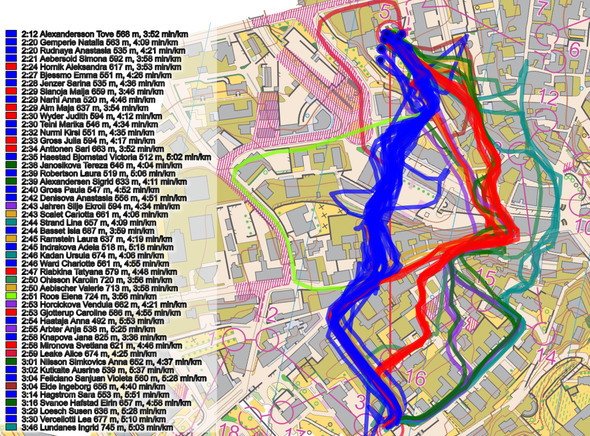
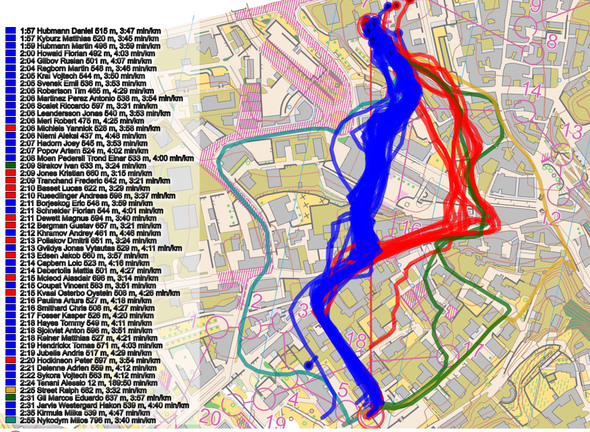
Then you can take a look at how the runners have solved this leg below. As you can see below, the straight route is clearly the fastest, but many, many runners choose to run more to the right, both for the men (two first graphs) and the women (last graph).
Here is the analysis for the women’s course from WorldofO’s article about EOC Sprint:
This it the “queen leg” of the race – as discussed already above. Alexandersson wins the leg with 8 seconds through excellent execution and choice of the best route (straight, blue color – around 545 meters length). Gemperle and Aebersold take the same choice and lose 8-9 seconds. Alm and Wyder run to the right (red – around 60-80 meters longer) and lose 17-18 seconds. Ohlsson runs far right (turquoise, 38 seconds time loss) and Roos runs far left (light green, 39 seconds time loss).
From behind the computer taking the direct blue route seems like a “no-brainer” – the competition pressure makes it much more tricky to see the small passages and to take the right choice.
And for the men:
The leg from control 6 to 7 is the major leg on the course – a leg where both Daniel Hubmann and Matthias Kyburz take the fastest routechoice (blue, nearly straight) while Kris Jones and Yannick Michiels run to the right (red routechoice), Jones losing more than 10 seconds of the 15 seconds he was behind at the end of the course. A few runners take really bad routechoices (Nykodym, Street), but most run either blue or red and thus the quite big time differences at this leg (half of the field lose 20+ seconds) is more about execution and running speed than about routechoice.
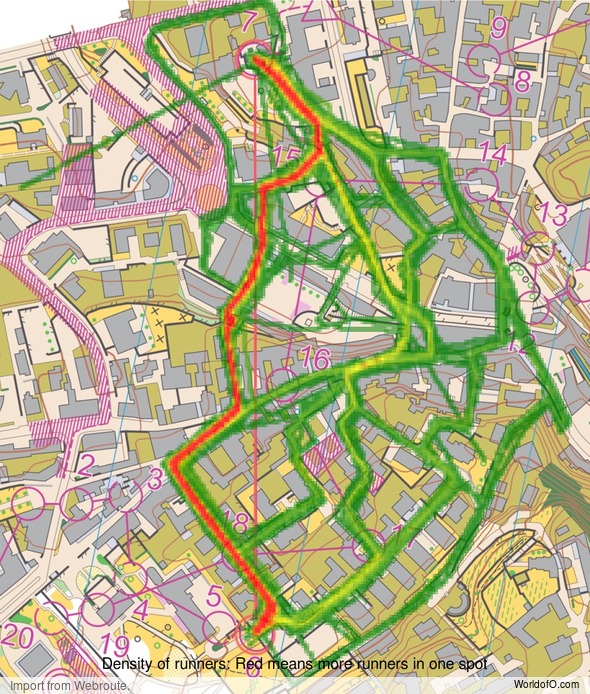
Density map
See below for a density map of some of the ones who have drawn their routes so far.
Additional information
You find the complete map in omaps.worldofo.com at this location.
Route to Christmas series
The Route to Christmas series is a pre-Christmas tradition at World of O – giving the readers the opportunity to do one Route Choice Challenge each day from December 1st until December 24th. If you have got any good legs in GPSSeuranta or 3DRerun from 2018-competitions – or old forgotten ones which are still interesting – please email me the link at Jan@Kocbach.net, and I’ll include it in Route to Christmas if it looks good. Route to Christmas will not be interesting if YOU don’t contribute.
Not all legs are taken for the interesting routechoice alternatives – some are also taken because the map is interesting – or because it is not straightforward to see what to do on a certain leg. Any comments are welcome – especially if you ran the event chosen for todays leg!
 World of O News
Nice analyses. Unfortunately you have mixed up ihe colors between the map and the entire text from the mens and womens race. No big deal……shit Happens 🙂
Johan: I just reread the text, and as far as I can see everything is correct. It is clearly stated that the analysis for the athletes refers to the athletes maps below, and as far as I can see colors on the map correspond exactly top the text. Please point out what is wrong, and I’ll fix it.
Fair enough. I were just confused why the colour of the different routechoices suddenly changes between the maps and the text. :-)
The main problem here is/was all the stairs, particularly those that are shown as multiple switchbacks:
It is really hard to evaluate how much time you will lose on those compared to flat out running in a straight line, the actual race split times shows that they were relatively fast in this event.
The stairs do affect the running speed quite a bit – just compare the running speed of those on the blue route (lots of stairs, Kyburz fastest @ 3:45 min/km) to the red route with much less stairs (Jonas Kristian fastest @ 3:15 min/km).
Yeah, we do know that stairs slow you down a lot, but the basic problem here was in fact to evaluate by how much! I.e. Kyburz’s speed up those switchback stairs must have been very impressive indeed. :-)