 World of O News

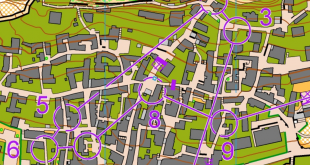
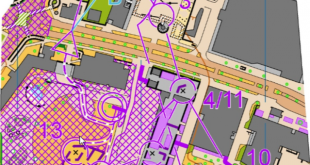
Small scandal in Finland [Updated with full analysis and map samples]: All teams did not run the same total course in Jukola 2011. The problem occured on the 1st and 2nd leg, where 100 out of 1500 starting teams had wrong forking. The best placed team with wrong forking seems to be IFK Moras in 14th spot. Above you see an example for OK Hällen and Moras. None of Mora’s runners had the western -variant – none of Hällen’s runners had the eastern variant.
The organizers have put up a message on the Jukola page (in Finnish) confirming the mistake:
– Jukola error has been detected scatter diagram. […] The organizers regret what happened.
The forking error explained
On the 1st and 2nd leg one runner should have 150-100-146 and the other 150-177-146 (controls 4-6 on the map below). For some teams both runners had either 150-100-146 or 150-177-146. The same problem also later on in the leg. Instead of one runner having 160-152-156-55 and the other 160-198-102-55 (controls 19-22 on the map below), both the 1st and 2nd leg runner in the teams had one of the variants.

Time losses?
So the question is – did this cost the affected teams time? Looking at the 5th control, it looks like the eastern one is more tricky than the western one, but we can’t know for sure. So instead of speculating, I calculated the mean time for all of the splits, and looked at the difference for the different control pairs. Note (1) that this will not give a correct answer at all, but it will give an indication of time lost/gained by the different teams and (2) these are quick calculations, I’ve only rechecked one time for errors.
Here are the average times I calculated. In addition I’ve also listed the best time on each split:
- 150-100: Average 04.38 – Best 02.29
- 100-146: Average 10.34 – Best 05.52
- 150-177: Average 10.47 – Best 06.09
- 177-146: Average 04.22 – Best 02.01
- 160-152: Average 02.43 – Best 01.21
- 152-156: Average 15.07 – Best 08.27
- 156-55: Average 01.15 – Best 00.44
- 160-196: Average 07.49 – Best 03.05
- 196-102: Average 13.56 – Best 06.58
- 102-55: Average 01.03 – Best 00.43
That gives the following for the average times/best splits for each of the variants:
- 150-100-146: Average 15.12 – Best 08.21
- 150-177-146: Average 15.09 – Best 08.10
- 160-152-156-55: Average 19.05 – Best 10.32
- 160-196-102-55: Average 22.48 – Best 10.46
If you calculate by the average time, the time gained/lost by the different teams is 3:40. If you go by the best times the time gained/lost is 3(!) seconds. Thus, it seems like teams doing few mistakes generally didn’t gain/loose significantly on this. On the other hand, the average time lost by having the worst “wrong” forking was quite big. The reason for this longer average time seems to be the tricky control 196, where several of the top teams with GPS-tracking made big mistakes. For example Kalevan Rasti who lost 4:17 to Halden on that control – more than they were behind Halden after 7 hours and 40 minutes of running. Kalevan Rasti had no problem with their forking though – they ran exactly the same controls as Halden. But some other teams had this tricky control two times – other teams didn’t have it at all…

Note again that these average calculations are based on automatic calculations from the Routegadget split files. I found some errors in the splits, so I can’t 100% guarantee for them…
Teams affected by the forking error
The following teams seem to have gotten a wrong forking (according to my analysis) – and were thus affected by the forking error:
- 14. IFK Moras OK 1 – gained time
- 30. Bäkkelagets SK 1 – gained time
- 49. Tampereen Pyrintö 2 – lost time
- 63. NTNUI 2 – gained time
- 80. OK Ravinen 1 – gained time
- 83. Ärla IF 1 – lost time
- 96. Vetelin Urheilijat 1 – gained time
- 97. Täby OK 1 – lost time
- 120. FK Göingarna 1 – gained time
- 133. Södertälje Nykvarn Orienter 3 – lost time
- 155. Bekkelagets Cowboys 1 – lost time
- 159. Tullinge SK 2 – lost time
- 185. Finspångs SOK / OK Tor 1 – gained time
- 198. Gjö-Vard OL 1 – lost time
- 204. Närpes OK 1 – gained time
- 205. Eksjö SOK 1 – gained time
- 294. Dalaportens OL 1 – gained time
- 301. Nastolan Terä 1 – lost time
- 309. IF Thor 1 – lost time
- 321. OK Kompas 1 – gained time
- 325. Kokkolan Suunnistajat 2 – lost time
- 330. Nash Klub 1 – gained time
- 341. Pohjankyrön Rasti 1 – gained time
- 355. OK Ravinen 3 – gained time
- 370. Karkki-Rasti 1 – gained time
- 376. Nostars 1 – lost time
- 381. DJK Adler 07 Bottrop 1 – lost time
- 403. OK Orion 4 – lost time
- 418. Tuupovaaran Sepot 1 – lost time
- 445. Partiolpk Tampereen Kotkat 1 – lost time
- 454. Oppsal IF 1 – lost time
- 467. Someron Esa 1 – gained time
- 468. Omega 2 – gained time
- 485. Sporttipalvelu Vesa Oksanen 1 – gained time
- 486. Keravan Urheilijat 5 – gained time
- 488. Hiiltonaiset 1 – lost time
- 502. Teme Ski Team 1 – gained time
- 514. Rastihaukat 1 – gained time
- 547. Panssariprikaati 1 – lost time
- 565. Hiiumaa OK 1 – gained time
- 570. IF Femman 2 – lost time
- 576. Arboga OK 2 – lost time
- 580. KuoLOn Kankeat 1 – gained time
- 611. OK Jorren 1 – lost time
- 626. IK Falken 1 – gained time
- 635. Saarijärven Pullistus 3 – gained time
- 640. RastiPiikkiö 1 – gained time
- 690. Peikot Hiihto 1 – lost time
- 697. OK Orient 4 – lost time
- 702. SK Vuoksi 3 – lost time
- 713. Stora Enso Metsä 2 – lost time
- 745. AS Skinnarila 2 – lost time
- 762. Hiidenkiertäjät 1 – gained time
- 767. Keravan Urheilijat 2 – gained time
- 793. IK Auseklis 3 – lost time
- 810. Länsi-Lavian Loiske 1 – gained time
- 815. Espoon Suunta 9 – lost time
- 831. Tamrock 1 – lost time
- 835. Alastaron Reserviläiset 2 – lost time
- 861. Rauman Työväen Urheilijat 1 – lost time
- 867. Sauvon Urheilijat 1 – lost time
- 876. SaniBeach Rats 1 – gained time
- 889. PuTi 1 – lost time
- 892. Peräkylän Ponnistus 1 – lost time
- 894. SKK-Dynamo 1 – gained time
- 895. Lankkuan Kyläjoukkue 1 – gained time
- 900. Turun Tiemiehet 1 – lost time
- 907. Someron Esa 2 – gained time
- 962. Hiukkasen Hukassa 1 – gained time
- 966. FanaGneist 1 – lost time
- 980. Pihkaniskat 7 – gained time
- 988. Koovee 5 – gained time
- 1023. Olarin Omat Pojat 2 – gained time
- 1028. Nordea Urheilu 1 – gained time
- 1044. Suuntavaisto SK 5 – lost time
- 1048. Valtra 1 – gained time
- 1051. Jalasjärven Jalas 2 – gained time
- 1053. Liperin Taimi 2 – gained time
- 1116. Vaaran Vaeltajat 1 – lost time
- 1123. Alajärven Ankkurit 3 – gained time
- 1131. Kilon Miekka 1 – gained time
- 1157. Riihimäen Suunnistajat 3 – lost time
- 1159. Kortesjärven Järvi-Veikot 3 – lost time
- 1166. Suunnaton Into 2 – lost time
- 1173. Rajamäen Rykmentti 8 – lost time
- 1193. Sotkamon Jymy 2 – lost time
- 1199. ABB SK 1 – gained time
- 1207. Kymin Suunnistajat 4 – gained time
- 1227. Suunnannäyttäjät 1 – lost time
- 1232. Hiidenkiertäjät 2 – lost time
- 1289. Sonninmäen Karjut 1 – gained time
- 1291. Erräät Oppaat 1 – gained time
- 1317. El Pantera 1 – gained time
- 1336. Hämeenlinnan Suunnistajat 3 – gained time
- 1339. Solf IK 1 – gained time
- 1342. Beach Boys 1 – lost time
- 1344. Maarian Mahti 2 – gained time
- 1400. Attunda OK 3 – lost time
- 1421. Jalasjärven Jalas 1 – lost time
- 1437. Eduskunnan Urheilukerho 1 – gained time
- 1439. OK Hällen 1 – lost time
Note! I found the first report about this on the Alternativet discussion forum posted by user Aj earlier today. I then run through the all the published splits, and found a list of 100 of 1500 teams with different forking from the winners. I then posted it on Twitter.

Impressive analysis!
I also discovered another strange thing about the forkings on leg 6. I was running 6th leg for IFK GBG, and my controlnumber on the 8th control was 149, and afterwards I had to go to controlnumber 153. According to the gps-tracking, this forking is not an option, it goes from one forking to another. Second strange thing is that my 10th control isn’t at all shown on the gps maps for the 6th leg runners. I had controlnumber 107, which was placed in the north-western edge of the most western forking on control number 10 on 6th leg. Maybe it’s an error on the gps map, or maybe it’s another forking error? If you follow the IFKG tracking, you will see the error.
Thanks for the comment. When analyzing the forking, I found no problems on other legs than leg 1 and 2, i.e. all teams have run exactly the same except for the problem on leg 1 and 2 for 100 teams (a made a general script which looked at all legs in total). So I suspect this is a problem with the GPS-map?
Yes, unfortunately there seems to be an error on gps-tracking maps with legs 4-7 forking in control 9. Two controls are in wrong forkings.
Mistake was already on maps that I got from organizers, most likely they were manually combined from each forking maps.
Also last leg’s forbidden areas were different in tracking maps than in actual competition maps. So no breaking of rules there.
I haven’t made such a deep analysis like you, so I guess you’re right:) Now I’ve been looking at split times for a couple of runners on leg 6, and I see there’s other than me who has the same forking, 149-153-107, so fortunately it should be a problem with the gps-map.
Comparing the average split times does not make sense. If a single team for example gets injured and spends one hour to a control, it has a big effect on the average time. Better statistics would be to calculate the median instead of the average.
I think the average of the 100 best times could be even better.
Agree, average of the 100 best times would be the best.
Which way to calculate it depends a lot on your situation. There is no “correct” way to calculate it in my opinion, because you never know how just your runner will be affected. If you are really unlucky and your team got twice the tricky control and both runners did a 5 minute mistake – while the neighbour club got twice the “easy” control and both did no mistakes – your team suddenly lost 10 minutes.
Still, I can agree that in some respects, it would be more correct to look at either (1) the 100 best splits or (2) the splits of the 100 best placed teams in the relay (according to final standing in the relay). I’d say (2) would actually be better, as what we want to assess here is the difficulty of the control, on not the time for somebody who takes the control perfectly. We’ve already looked at the fastest splits, and can see that it is possible to run the controls with the same speed. As Tuomo says another option would also be to look at the median, but I think looking at the 100 best placed team is a nice way to do it (I could of course have picked the 200 best placed, 300 … – but we already know that the time lost/gained will gradually increase from the value calculated below to 3:40 when including more teams).
Unfortunately the day has only 24 hours, so it takes too much time to give you all you want. But at least I put my script through to pick up the average of 100 best times and the average of times of 100 best finishing teams and did some quick calculations:
150-100: Av. 100 best splits 02:46 – Av. 100 best teams 03:10
100-146: Av. 100 best splits 06:30 – Av. 100 best teams 06:51
150-177: Av. 100 best splits 06:48 – Av. 100 best teams 07:04
177-146: Av. 100 best splits 02:16 – Av. 100 best teams 02:26
160-152: Av. 100 best splits 01:35 – Av. 100 best teams 01:42
152-156: Av. 100 best splits 08:23 – Av. 100 best teams 09:45
156-55: Av. 100 best splits 00:50 – Av. 100 best teams 00:52
160-196: Av. 100 best splits 03:25 – Av. 100 best teams 04:09
196-102: Av. 100 best splits 07:14 – Av. 100 best teams 08:30
102-55: Av. 100 best splits 00:49 – Av. 100 best teams 00:51
A quick look at these times (you can check more if you have time) indicates that
My analysis http://www2.suunnistus.info/sf/anal/vert.joukkue.pir?kisa=2011-Jukola
calculate “optimum time/leg” using 4 the best times.
With this calculation the slowest case is
2*150-100-146 and 2*160-196-102-55.
Fastest is the 2*150-177-146 and 2*160-152-156-55.
This way max time difference is 1:24. But this combination wasn’t used any teams in top 100.
Between used combination time cap is about 36 s.
Lucky in the top 100 was TP 2, Ärlä IF 1, Täby OK 1 and not so lucky was IF Moras OK 1, Bäkkelagets SK 1, NTNUI 2, OK Ravinen 1 and Vetelin Urheilijat 1.
But there is also about 22 s cap between legal combination, running order section in leg 1 or leg 2. Open areas are not so much faster in leg 2, but many green section are => open area forks in leg1 and green forks in leg2 = lucky winner always.
I also got an email from Tuomas K. with an analysis – I add a comment about it here so you can take a look:
http://madiventures.blogspot.com/2011/06/jukola-2011-1st-leg-short-view-to.html