 World of O News
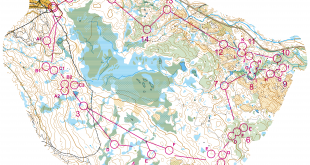
Todays leg in Route to Christmas is from the World Championships middle distance final in Trondheim, Norway. This course has got a lot of negative remarks in the orienteering community, but it still contains some interesting legs. One of these legs is leg number 7 in the mens class, which is discussed in a lot of detail in todays edition of Route to Christmas.
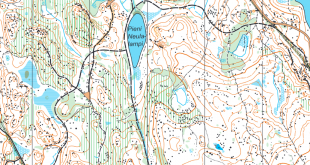
This was actually one of the legs which had significant influence on the overall results in this years WOC middle distance, Carl Waaler Kaas taking some time from the other medal contenders. The leg is as usually first provided without routes – you may take a look at it and think about how you would attack this leg (if the image is too small, you may click on it to get it larger):
![]()
Webroute
Next you can draw your own route using the ‘Webroute’ below. Think through how you would attack this leg, and draw the route you would have made. Some comments about why you would choose a certain route are always nice for the other readers.
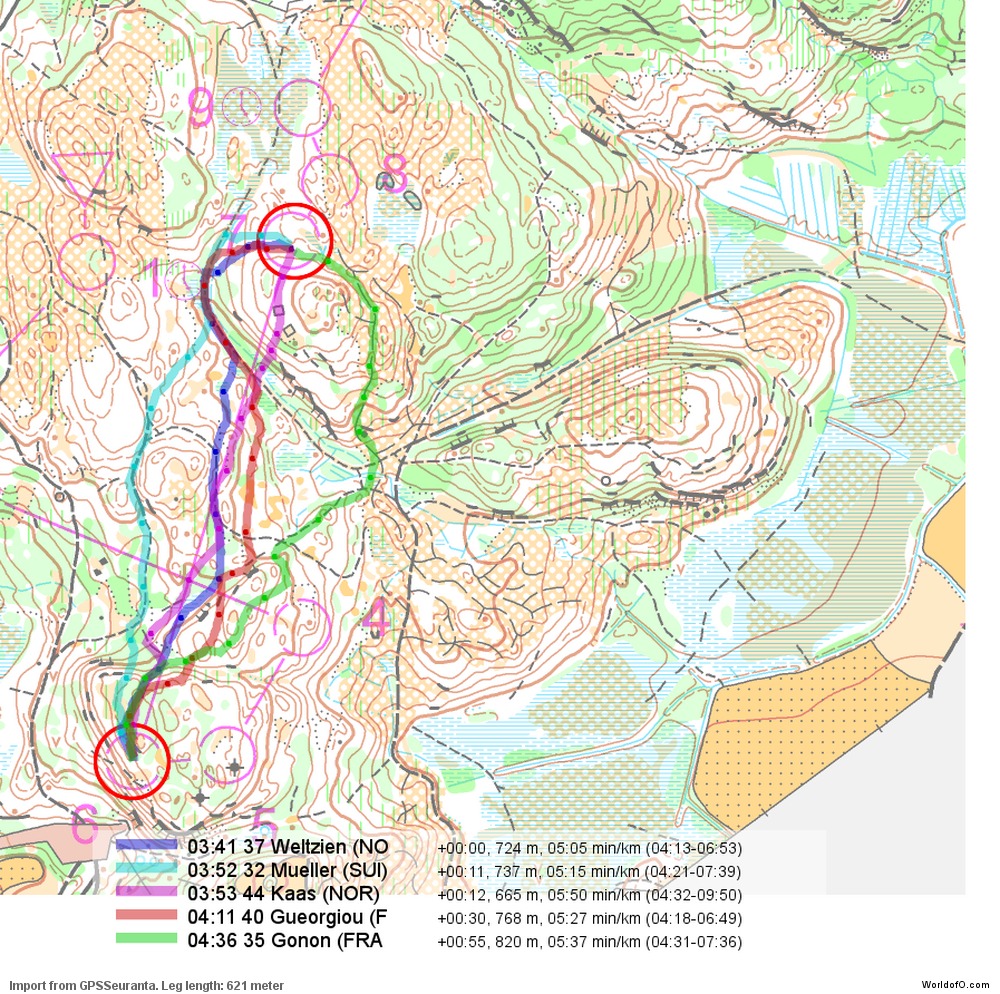
Then we start analyzing the GPS data from the leg. All runners in the WOC final wore a GPS, and therefore there is quite a lot of data to analyze here. First we compare the best runners on each of the distinct routes run on this leg. Note that the times given are off by up to 3-4 seconds compared to the official splits due to the inaccuracy in the GPS data and start/stop point.
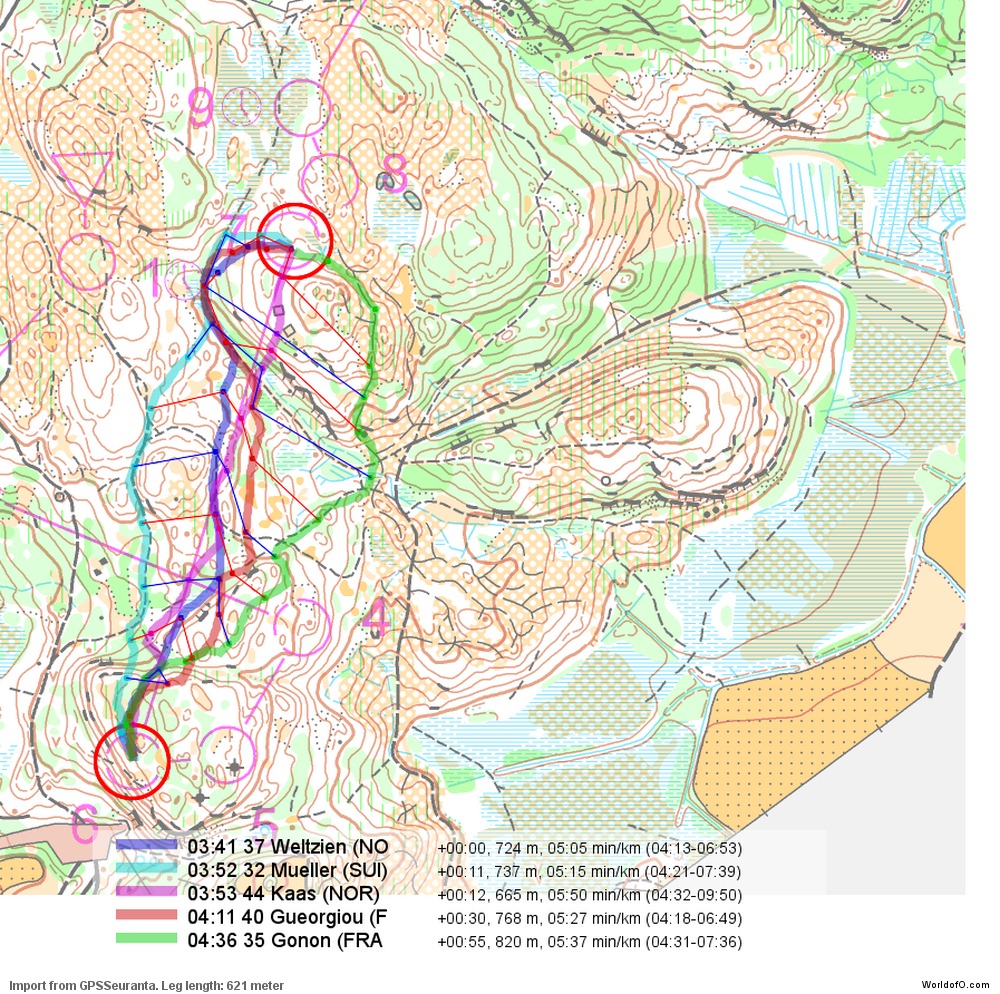
To get information about where on the leg these runners have lost/won time, we plot isochrones by plotting a dot at the points where the runners have used 20 seconds, 40 seconds, 60 seconds and so on – and connect these with a line. Thus it is now possible to see how Weltzien earns most of his advantage in the first half of the leg – and Gueorgiou looses time at the first part of the leg.
To get more of a feeling about how the field in the WOC middle final spread out on the different alternative routes – and the distribution of fast times on each alternative – we plot all routes on the same map with red color for slow overall time for the leg and green color for fast overall time for the leg. You can here see that most of runners who run fast times choose one of the left variants. There is only one fast runner on the direct alternative, and that is Carl Waaler Kaas. Thus based on this a left variant should be the optimum on this leg.

Next we divide the leg in a large grid, and find the minimum pace run by any runner on each cell of the grid. Fast areas are visualized with a green color – slow areas with a red color. There are several interesting observations to be made from this pace distribution illustration. For example, for the first part of the leg the runnability seems to be a lot better just below the hill than on the hill-top (the spot where we earlier saw that Gueorgiou lost time). Also, we see how the path going up the hill on the eastern route choice is slow. Note that the pace distribution here is probably influenced by the fact that fewer runners took the eastern alternative – if more (top placed) runners would have chosen the eastern option the pace might have been higher there.

Based on this pace distribution map, it is possible to set up an illustration showing the calculated optimal route (black in the illustration below). It is also possible to identify all points which you can reach in a certain time from the start control. In the illustration below, all points which can be reached at the same time have the same color. Thus it is possible to get an overview over the possibilities for the leg. In particular, it is possible to see where control number 7 should have been positioned in order for the eastern route alternative to be faster (based on the speed data available, which is probably not 100% correct due to the distribution of runners). When studying the illustration, it is clear that the control should be placed in the middle of the blue in the area where the color changes from green to blue to green some 50 meters to the east of control number 7.

To make the above discussion a bit clearer, the control has been moved to 4 different position, and the optimal route has been calculated for each position. As you can see, the optimal route changes for the different control positions – the eastern control position giving the eastern routechoice as the optimum (note again that the control could probably have been placed a bit more to the west).

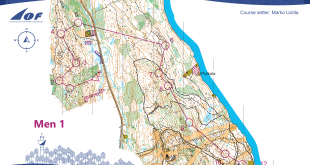
Complete map in Omaps.worldofo.com
You find the complete map and Routegadget info in omaps.worldofo.com at this location.
Omaps.worldofo.com
The ‘Route to Christmas’ series at World of O was very popular the last years – and I’ve therefore decided to continue the series this Christmas as well. If you have got any good legs in RouteGadget from 2010-competitions – or old forgotten ones which are still interesting – please email me the link at Jan@Kocbach.net, and I’ll include it in Route to Christmas if it looks good. Route to Christmas will not be interesting if YOU don’t contribute.
There will be no analysis about the best routechoice for each leg – you can provide that yourself in the comments or in the Webroute. Not all legs are taken for the interesting routechoice alternatives – some are also taken because the map is interesting – or because it is not straightforward to see what to do on a certain leg. Any comments are welcome – especially if you ran the event chosen for todays leg!
“For example, for the first part of the leg the runnability seems to be a lot better just below the hill than on the hill-top (the spot where we earlier saw that Gueorgiou lost time).”
So was the map bad?
Another very nice tool for analysis, Jan! With as much GPS-data as available here, the results become reliable to a high extent.
I still have to comment some of the content in the text. I hope that the most of us in the “orienteering community” are able to see the difference between choice of terrain and quality of course-setting. I find it very un-fair that the course-setters of the middle distance over and over have to take the blame for the decisision of having that final in this area. I think that the leg analyzed in this article is a good example of how a fair, but decisive leg could be, and show that they made a solid work.
From the spread of the route-choices, we see that there are a lot of alternatives, both on micro and macro level, and the split times show that some are significantly better than others.
You comment that the path going up the hill on the eastern route choice is slow, and as this is not a path, but a ‘narrow ride’ (symbol 509), the runability is not better than the area the ride runs through.
One of the key ideas of course-setting is that legs should be “visually” balanced, but still require different time and skills on the different route-choises. By moving control 7 east to(wards) the open area, most of the runners would probably prefer the eastern choice (with a simple entrance to the control), even if the leg then is balanced in time. (It was many enough of simple “TV-controls” already decided…)
This shows that this tool is more (and excellent!) for analysis than course-setting.
Keep up the good work, Jan!
..and Merry Christmas to you all!
I want second most of Ivar’s comments, and add one of my own:
The “best” route choice has to balance speed vs risk, right?
With 100% GPS tracking we can determine, for each runner, how fast they were on average, by taking their relative speed (vs the fastest runner) on their medium position leg.
I.e. if you have a few very fast legs, and a few relatively slow legs, and the majority around 10-20’th position, then we can take that 15’th position speed (maybe 5% down from the leg winner?) as the base speed of that runner, right?
At this point we can then determine how much each runner have lost due to mistakes on each leg, and allocate each mistake to a given route choice, and get a measure of the average loss due to misses for each alternative.
Adding this to the calculated optimum time for each route choice gives the _expected_ time, which is quite likely to be higher for a risky, direct route choice than a safer & easier alternative.