 World of O News
Todays leg in Route to Christmas is from the first competition in the Nordic Tour in Finland. The leg is not as long as the legs of the last days – it is rather chosen because this is the event I have found with the most GPS units applied [77(!) GPS units just in the mens class] – and therefore this is a very interesting event for some analysis using the GPS data.
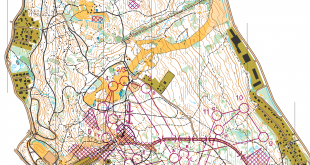
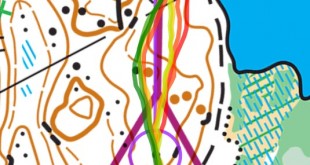
The leg is as usually first provided without routes – you may take a look at it and think about how you would attack this leg (if the image is too small, you may click on it to get it larger):
![]()
Webroute
Next you can draw your own route using the ‘Webroute’ below. Think through how you would attack this leg, and draw the route you would have made. Some comments about why you would choose a certain route are always nice for the other readers.
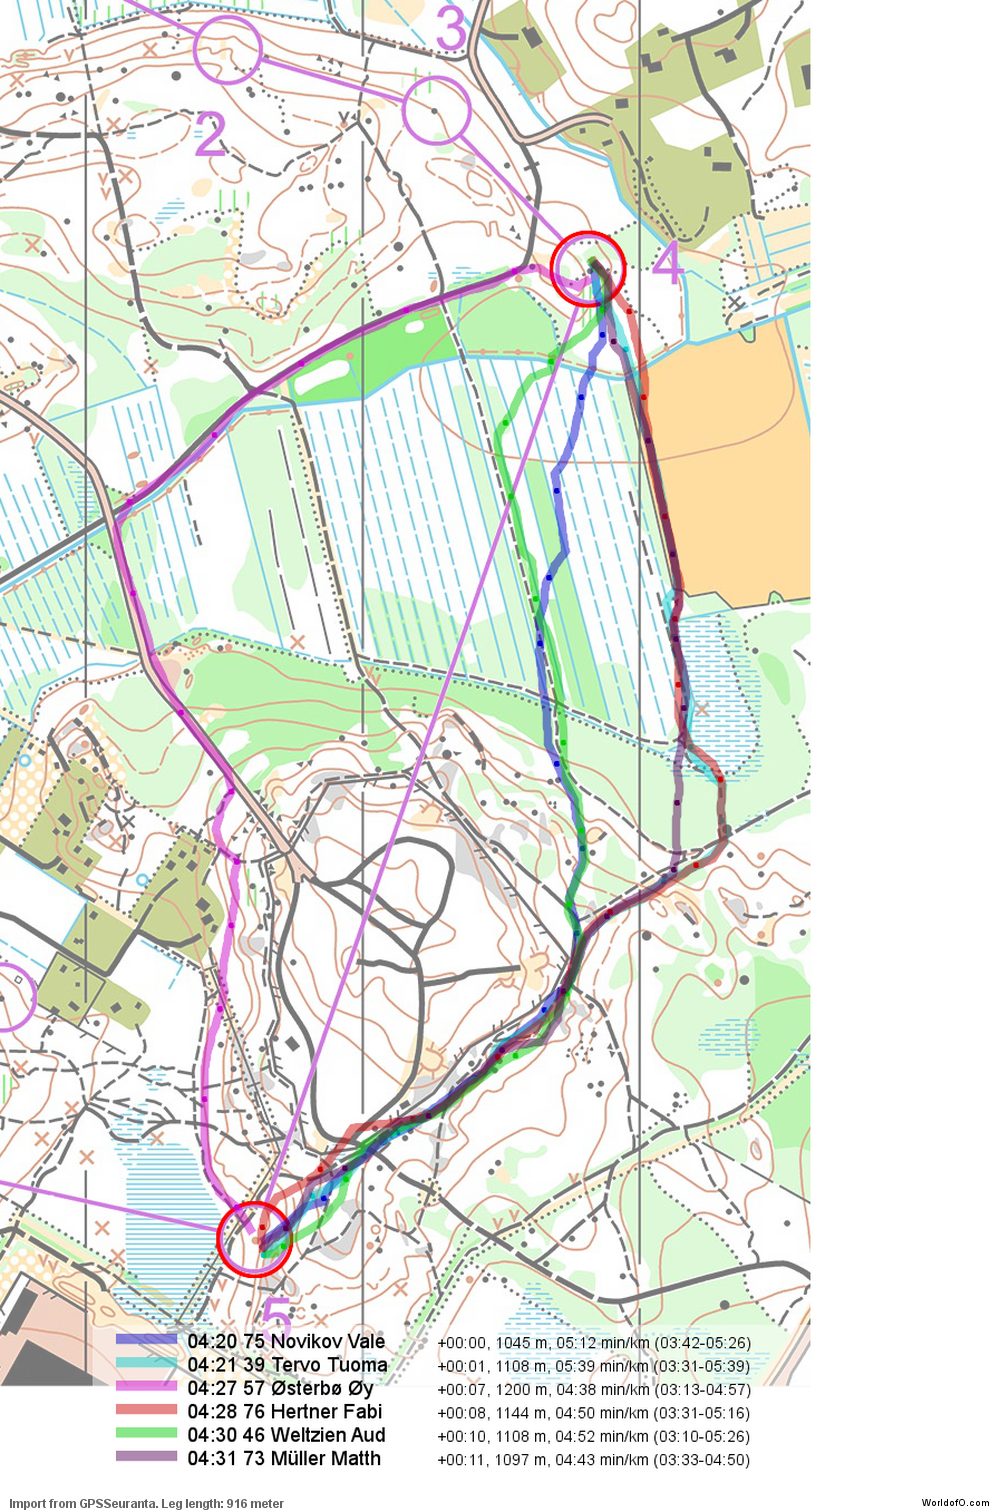
Then you can take a look at the best splits for this leg based on the GPS data (I could not find the splits anywhere online – they might be off by some seconds – hopefully not so much as to change the conclusions:). As you can see Valentin Novikov is fastest on the leg on a direct/left route – some seconds faster than the right and left variants.
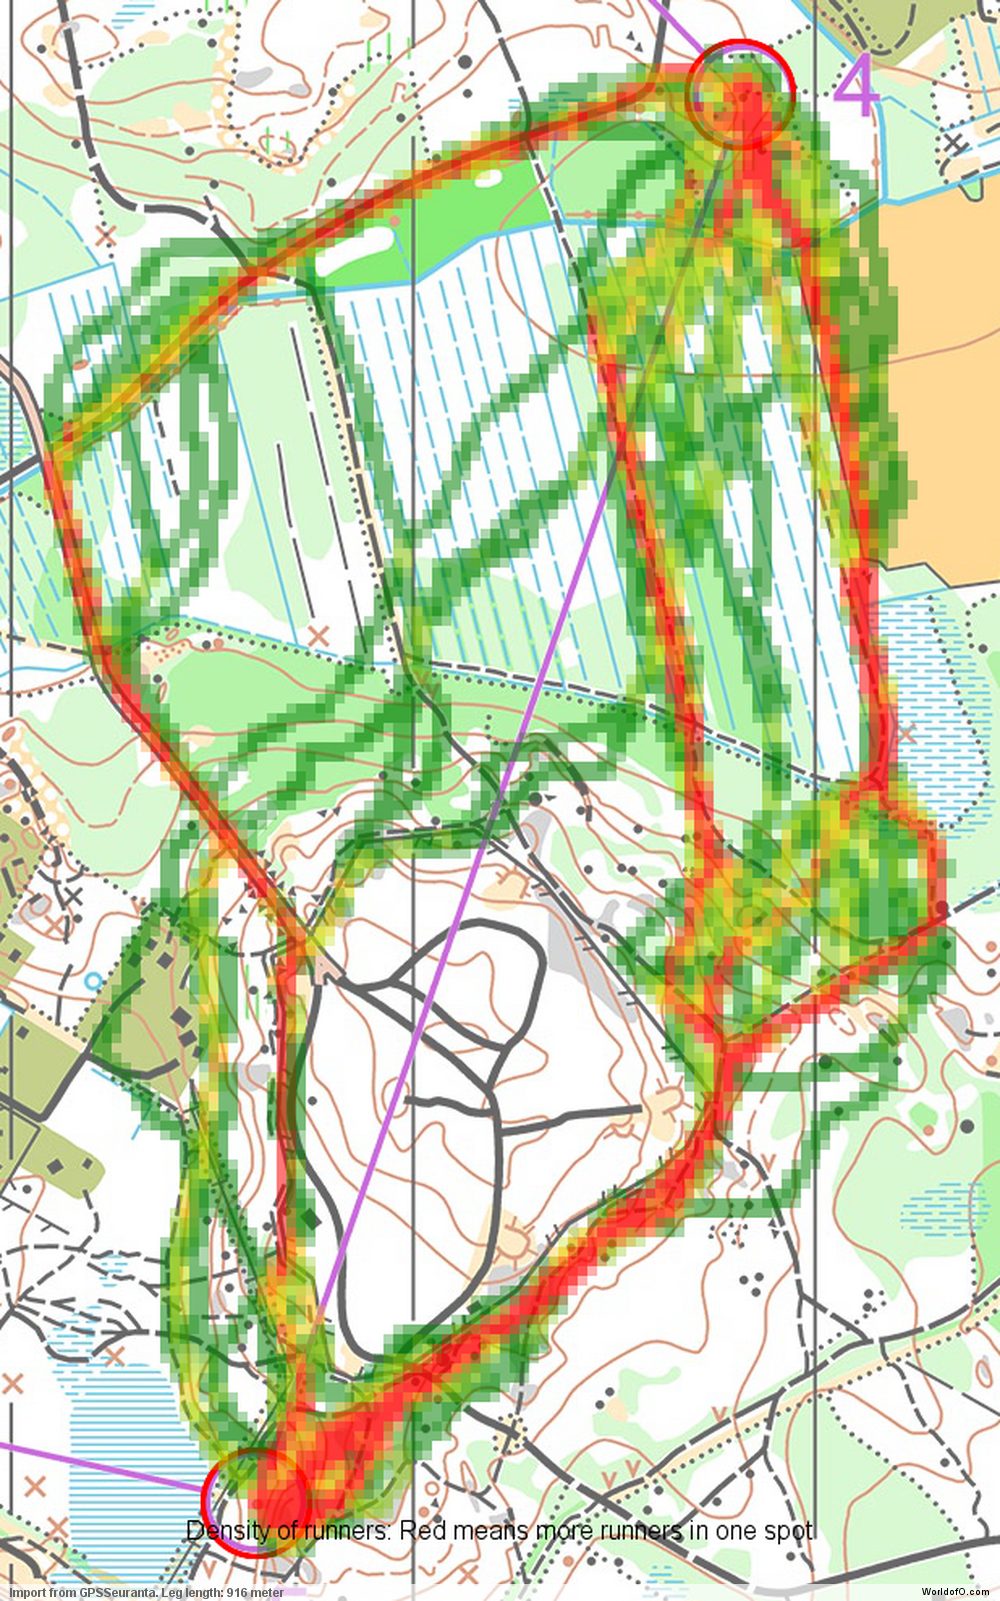
When we start looking in more detail at the GPS data, it starts to get more interesting. First a density map which shows how many runners choose each route. Red color means that more runners choose a particular route. As you can see, there are three distinctive routes which are chosen by a majority of the runners.
Next we take a look at the pace distribution, i.e. how fast the fastest runners have been on different parts of the leg. Here green is fast and red is slow.

Based on this pace distribution, we can now (as described in the Route to Christmas of yesterday) calculate the time it takes to run to any point on which runners have been on this leg. This is visualized in the below illustration where all points with the same color take the same time to reach. Here one can clearly see how the left/direct variant is significantly faster than the right variant, i.e. the green color is much closer to the control when following the left route than the right route. You can also observe that the direct route actually has potential for being faster than the right variant. The optimal route is again drawn in solid black – no surprises there – it is very similar to the route of Valentin Novikov, except he should have cut through the green and over to the path a bit earlier after around one fourth of the leg.

Finally, an iso-time plot, i.e. an illustration which connects the positions at which runners have used equal time from the start of the leg. This is another way to visualize how Novikov reaches the control ahead of Østerbø.

So I guess that in today’s Route to Christmas we can be fairly certain that the direct/left variant of Valentin Novikov is really the fastest on the leg – or have you found a better option? I’m sorry that you didn’t get a long, tough leg like I know most of you like today, but I couldn’t let the chance of looking at all this GPS data run away…
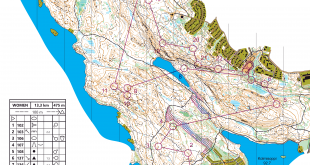
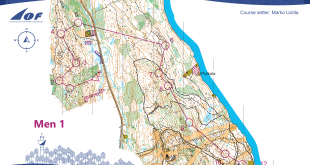
Complete map in Omaps.worldofo.com
You find the complete map and Routegadget info in omaps.worldofo.com at this location.
Omaps.worldofo.com
The ‘Route to Christmas’ series at World of O was very popular the last years – and I’ve therefore decided to continue the series this Christmas as well. If you have got any good legs in RouteGadget from 2010-competitions – or old forgotten ones which are still interesting – please email me the link at Jan@Kocbach.net, and I’ll include it in Route to Christmas if it looks good. Route to Christmas will not be interesting if YOU don’t contribute.
There will be no analysis about the best routechoice for each leg – you can provide that yourself in the comments or in the Webroute. Not all legs are taken for the interesting routechoice alternatives – some are also taken because the map is interesting – or because it is not straightforward to see what to do on a certain leg. Any comments are welcome – especially if you ran the event chosen for todays leg!
For me it seems a bit strange legend. How can it be that Novikov was just 1 sec faster then Tervo, had 54meters shorter route choice, but his speed is still 5’12” per km, which is 27sec faster than Tervo’s speed, and isn’t even mathematically correct as 4’20” divided by 1.045km would make the average speed as 4’10″? Can you please explain the legend, Jan?
@Renchix: As I wrote in a comment yesterday, I think there is a bug in the calculated min/km:) Too late to fix that in the rest of Route to Christmas, but I’ll take a look at it for further analysis.
Doesn’t it seem strange, that in the forest with all the ditches south of control 4, the runnability in the white is slower than in the green parts?
Thinking further with all the calculations and interpolations it may be possible in the future with GPS-use to determine speed in a certain part of the terrain. Thus, using this method one could invent fluent green shades to show the runnability in maps of the future?